Technology
The Extraordinary Size of Amazon in One Chart
The Extraordinary Size of Amazon in One Chart
It’s bigger than most brick and mortar retailers together
The Chart of the Week is a weekly Visual Capitalist feature on Fridays.
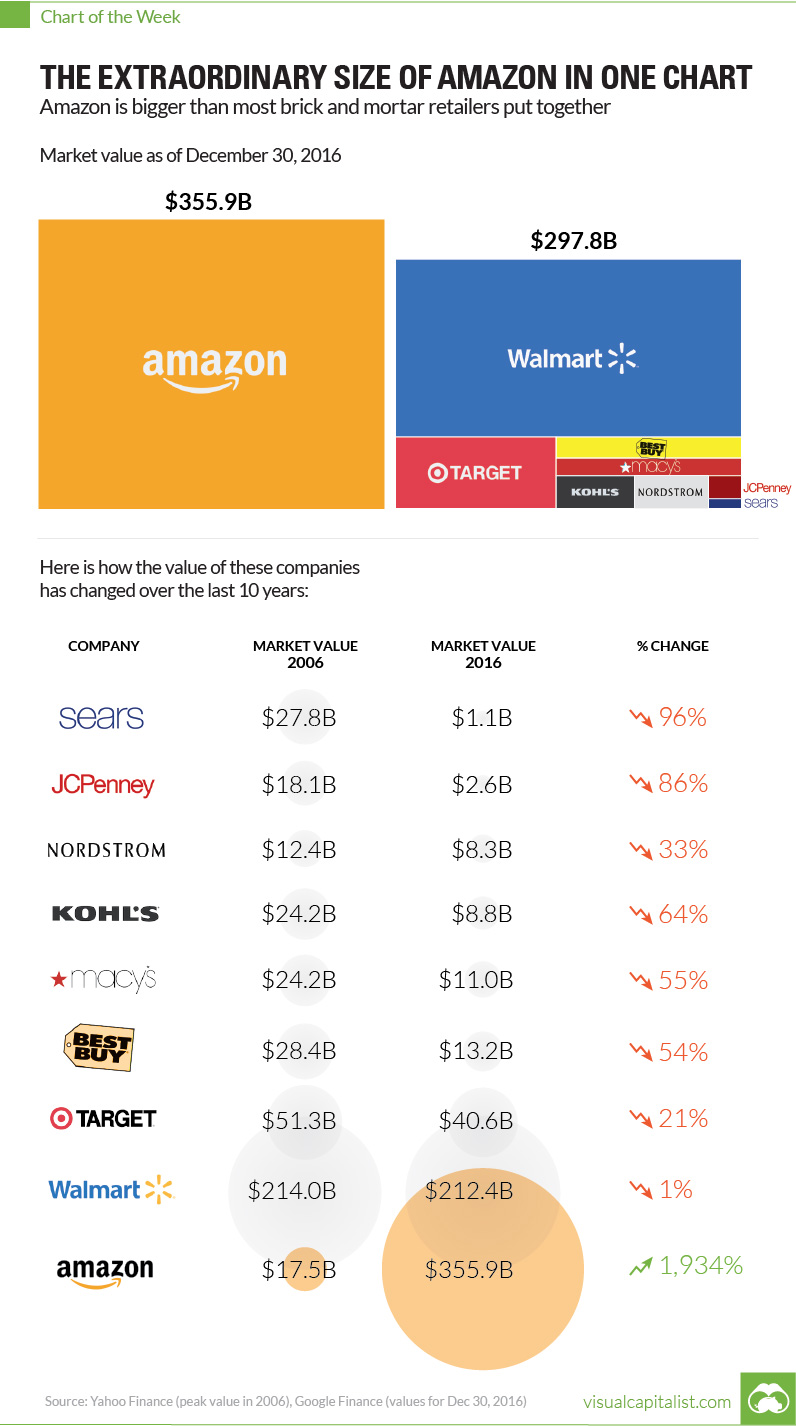
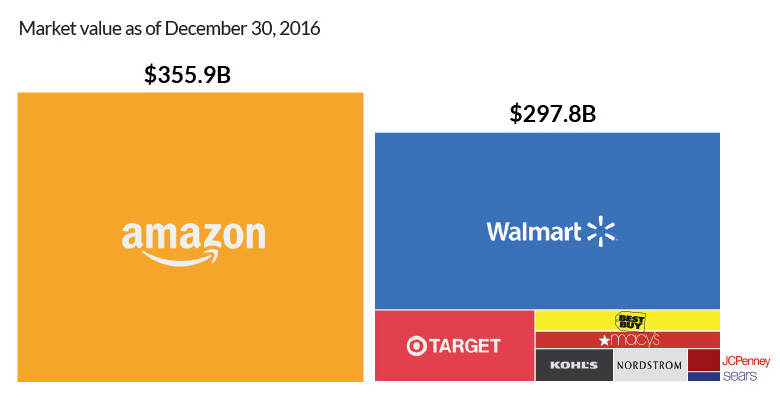
What has more value: all major publicly traded department stores in the United States, or Amazon?
Amazon takes the cake, and its no contest.
Add together the market caps of Walmart, Target, Best Buy, Nordstrom, Kohl’s, JCPenney, Sears, and Macy’s, and they amount to a significant $297.8 billion:
| Brick & Mortar Store | 2016 Value ($B) |
|---|---|
| Sears | $1.1 |
| JCPenney | $2.6 |
| Nordstrom | $8.3 |
| Kohl's | $8.8 |
| Macy's | $11.0 |
| Best Buy | $13.2 |
| Target | $40.6 |
| Walmart | $212.4 |
| Total | $297.8 |
However, it’s not enough to beat the Amazon machine.
The online retailer alone is worth $356 billion, making it one of the largest companies by market capitalization in the world.
The Death of Traditional Retail
Ten years ago, the future of brick and mortar retail sill looked bright. The aforementioned retailers were worth a collective $400 billion, and Amazon was only valued at $17.5 billion.
But disruption often comes without warning. Or if there were warning signs, they went unheeded by retailers.
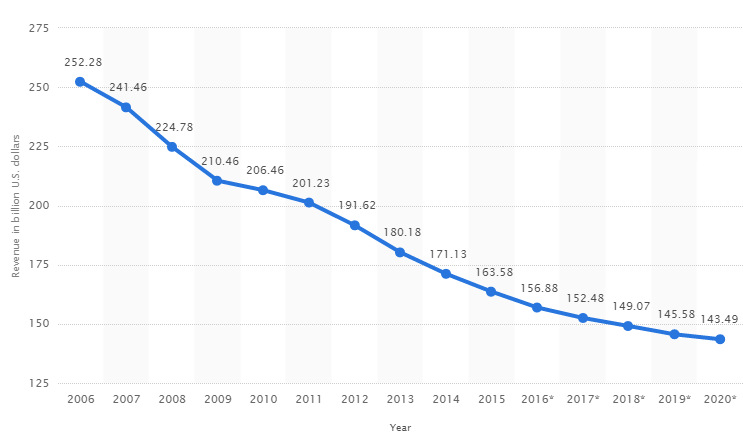
Big box and department store sales plummeted, as consumers increasingly went online to do their shopping. This year, it is estimated that revenues are equal to just 62% of their totals in 2006:
Big Box and Department Store Sales ($ Billion)
Retailers without the right strategy saw their market caps plummet.
Sears went from being worth $27.8 billion to $1.1 billion (a 96% decrease), while JCPenney went from $18.1 billion to $2.6 billion (a 86% decrease).
Here’s the full damage over the last 10 years to brick and mortar stores:
| Store | 2006 Value ($B) | 2016 Value ($B) | % Change |
|---|---|---|---|
| Sears | $27.8 | $1.1 | -96% |
| JCPenney | $18.1 | $2.6 | -86% |
| Nordstrom | $12.4 | $8.3 | -33% |
| Kohl's | $24.2 | $8.8 | -64% |
| Macy's | $24.2 | $11.0 | -55% |
| Best Buy | $28.4 | $13.2 | -54% |
| Target | $51.3 | $40.6 | -21% |
| Walmart | $214.0 | $212.4 | -1% |
| Total | $400.4 | $297.8 | -26% |
Amazon, on the other hand, did okay for itself.
The online retailer gained 1,934% in value over the same timeframe, making it one of the most valuable companies in the world, and a key piece of Jeff Bezos’ business empire.


Technology
Visualizing AI Patents by Country
See which countries have been granted the most AI patents each year, from 2012 to 2022.


Visualizing AI Patents by Country
This was originally posted on our Voronoi app. Download the app for free on iOS or Android and discover incredible data-driven charts from a variety of trusted sources.
This infographic shows the number of AI-related patents granted each year from 2010 to 2022 (latest data available). These figures come from the Center for Security and Emerging Technology (CSET), accessed via Stanford University’s 2024 AI Index Report.
From this data, we can see that China first overtook the U.S. in 2013. Since then, the country has seen enormous growth in the number of AI patents granted each year.
| Year | China | EU and UK | U.S. | RoW | Global Total |
|---|---|---|---|---|---|
| 2010 | 307 | 137 | 984 | 571 | 1,999 |
| 2011 | 516 | 129 | 980 | 581 | 2,206 |
| 2012 | 926 | 112 | 950 | 660 | 2,648 |
| 2013 | 1,035 | 91 | 970 | 627 | 2,723 |
| 2014 | 1,278 | 97 | 1,078 | 667 | 3,120 |
| 2015 | 1,721 | 110 | 1,135 | 539 | 3,505 |
| 2016 | 1,621 | 128 | 1,298 | 714 | 3,761 |
| 2017 | 2,428 | 144 | 1,489 | 1,075 | 5,136 |
| 2018 | 4,741 | 155 | 1,674 | 1,574 | 8,144 |
| 2019 | 9,530 | 322 | 3,211 | 2,720 | 15,783 |
| 2020 | 13,071 | 406 | 5,441 | 4,455 | 23,373 |
| 2021 | 21,907 | 623 | 8,219 | 7,519 | 38,268 |
| 2022 | 35,315 | 1,173 | 12,077 | 13,699 | 62,264 |
In 2022, China was granted more patents than every other country combined.
While this suggests that the country is very active in researching the field of artificial intelligence, it doesn’t necessarily mean that China is the farthest in terms of capability.
Key Facts About AI Patents
According to CSET, AI patents relate to mathematical relationships and algorithms, which are considered abstract ideas under patent law. They can also have different meaning, depending on where they are filed.
In the U.S., AI patenting is concentrated amongst large companies including IBM, Microsoft, and Google. On the other hand, AI patenting in China is more distributed across government organizations, universities, and tech firms (e.g. Tencent).
In terms of focus area, China’s patents are typically related to computer vision, a field of AI that enables computers and systems to interpret visual data and inputs. Meanwhile America’s efforts are more evenly distributed across research fields.
Learn More About AI From Visual Capitalist
If you want to see more data visualizations on artificial intelligence, check out this graphic that shows which job departments will be impacted by AI the most.

-

 Mining1 week ago
Gold vs. S&P 500: Which Has Grown More Over Five Years?
-

 Markets2 weeks ago
Ranked: The Most Valuable Housing Markets in America
-

 Money2 weeks ago
Which States Have the Highest Minimum Wage in America?
-

 AI2 weeks ago
Ranked: Semiconductor Companies by Industry Revenue Share
-

 Markets2 weeks ago
Ranked: The World’s Top Flight Routes, by Revenue
-

 Countries2 weeks ago
Population Projections: The World’s 6 Largest Countries in 2075
-

 Markets2 weeks ago
The Top 10 States by Real GDP Growth in 2023
-

 Demographics2 weeks ago
The Smallest Gender Wage Gaps in OECD Countries