Technology
18 Media Technologies, Sorted by Adoption Rate
18 Media Technologies, Sorted by Adoption Rate
The Chart of the Week is a weekly Visual Capitalist feature on Fridays.
As you read this, know that you are not alone.
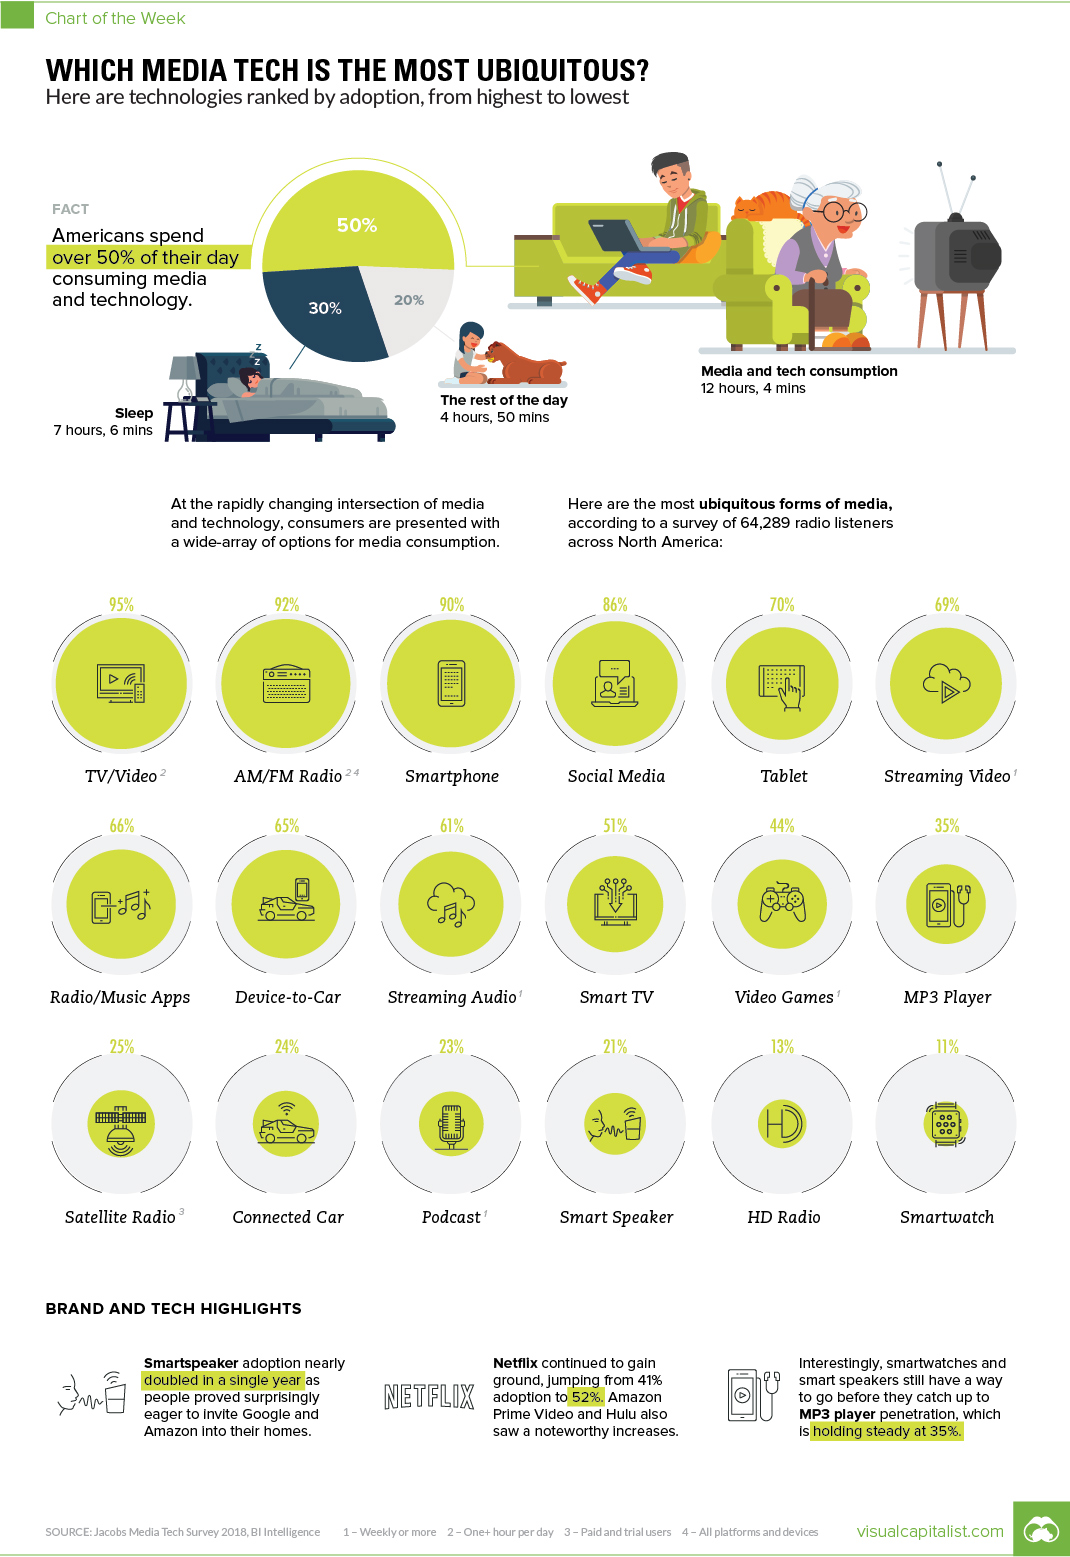
Statistically speaking, over 50% of people are consuming media in some form at this given moment.
In fact, the latest data shows that Americans spend over 12 hours per day consuming media in various forms. This means that people spend more time consuming media than they do working or sleeping – a prolific insight that explains why companies like Apple, Alphabet, Facebook, and Netflix have exploded in size and dominance over the last decade.
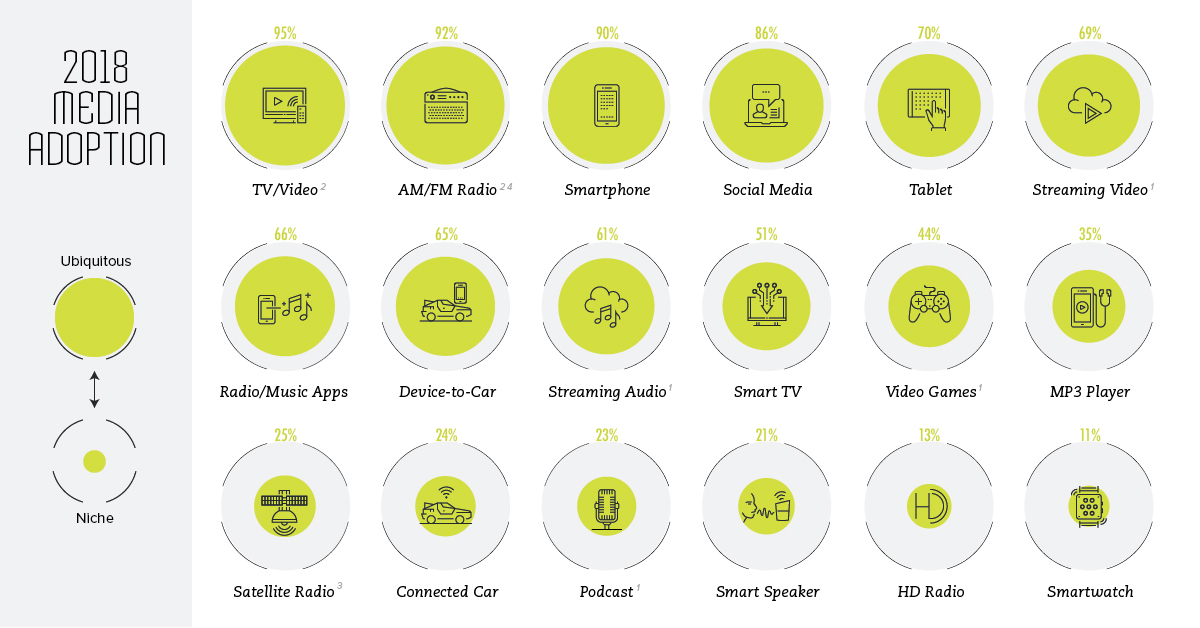
Media Adoption in 2018
Using the most recent survey data from Jacobs Media, we can get a sense of how all of this media is actually being consumed.
The following data shows the survey results of 64,289 radio listeners in North America to highlight the adoption rates for 18 different media technologies, ranging from television to smartwatches.
| Rank | Media Type | Adoption Rate |
|---|---|---|
| #1 | TV/Video | 95% |
| #2 | AM/FM Radio | 92% |
| #3 | Smartphone | 90% |
| #4 | Social Media | 86% |
| #5 | Tablet | 70% |
| #6 | Streaming Video | 69% |
| #7 | Radio/Music Apps | 66% |
| #8 | Device-to-Car | 65% |
| #9 | Streaming Audio | 61% |
| #10 | Smart TV | 51% |
| #11 | Video Games | 44% |
| #12 | MP3 Plaer | 35% |
| #13 | Satellite Radio | 25% |
| #14 | Connected Car | 24% |
| #15 | Podcast | 23% |
| #16 | Smart Speaker | 21% |
| #17 | HD Radio | 13% |
| #18 | Smartwatch | 11% |
Conventional mediums like television still reign supreme for now.
However, it’s worth noting that the intersection of media and technology is a rapidly-evolving space – and there are several mediums that are jumping up the rankings fast.
Movers and Shakers
We previously covered the ultra-competitive battle for smart speaker market share, and the data here gives further indication to how fast the space is evolving. In the 2018 edition of the survey, smart speakers held a 21% penetration rate – that’s almost double the rate in the 2017 survey, which was only at 11%.
In the video streaming space, Netflix continues its rapid growth – something that was also evident in the internet minute graphic that we shared with you earlier in the week. Users watching Netflix at least once per week jumped from 41% to 52% between 2017 and 2018.
Finally, in other brand news, Facebook is used on a weekly basis by 74% of respondents. Other social media platforms like Instagram and Snapchat were well behind Facebook in overall media usage, but are still growing in terms of users.


Technology
Visualizing AI Patents by Country
See which countries have been granted the most AI patents each year, from 2012 to 2022.


Visualizing AI Patents by Country
This was originally posted on our Voronoi app. Download the app for free on iOS or Android and discover incredible data-driven charts from a variety of trusted sources.
This infographic shows the number of AI-related patents granted each year from 2010 to 2022 (latest data available). These figures come from the Center for Security and Emerging Technology (CSET), accessed via Stanford University’s 2024 AI Index Report.
From this data, we can see that China first overtook the U.S. in 2013. Since then, the country has seen enormous growth in the number of AI patents granted each year.
| Year | China | EU and UK | U.S. | RoW | Global Total |
|---|---|---|---|---|---|
| 2010 | 307 | 137 | 984 | 571 | 1,999 |
| 2011 | 516 | 129 | 980 | 581 | 2,206 |
| 2012 | 926 | 112 | 950 | 660 | 2,648 |
| 2013 | 1,035 | 91 | 970 | 627 | 2,723 |
| 2014 | 1,278 | 97 | 1,078 | 667 | 3,120 |
| 2015 | 1,721 | 110 | 1,135 | 539 | 3,505 |
| 2016 | 1,621 | 128 | 1,298 | 714 | 3,761 |
| 2017 | 2,428 | 144 | 1,489 | 1,075 | 5,136 |
| 2018 | 4,741 | 155 | 1,674 | 1,574 | 8,144 |
| 2019 | 9,530 | 322 | 3,211 | 2,720 | 15,783 |
| 2020 | 13,071 | 406 | 5,441 | 4,455 | 23,373 |
| 2021 | 21,907 | 623 | 8,219 | 7,519 | 38,268 |
| 2022 | 35,315 | 1,173 | 12,077 | 13,699 | 62,264 |
In 2022, China was granted more patents than every other country combined.
While this suggests that the country is very active in researching the field of artificial intelligence, it doesn’t necessarily mean that China is the farthest in terms of capability.
Key Facts About AI Patents
According to CSET, AI patents relate to mathematical relationships and algorithms, which are considered abstract ideas under patent law. They can also have different meaning, depending on where they are filed.
In the U.S., AI patenting is concentrated amongst large companies including IBM, Microsoft, and Google. On the other hand, AI patenting in China is more distributed across government organizations, universities, and tech firms (e.g. Tencent).
In terms of focus area, China’s patents are typically related to computer vision, a field of AI that enables computers and systems to interpret visual data and inputs. Meanwhile America’s efforts are more evenly distributed across research fields.
Learn More About AI From Visual Capitalist
If you want to see more data visualizations on artificial intelligence, check out this graphic that shows which job departments will be impacted by AI the most.

-

 Mining1 week ago
Gold vs. S&P 500: Which Has Grown More Over Five Years?
-

 Markets2 weeks ago
Ranked: The Most Valuable Housing Markets in America
-

 Money2 weeks ago
Which States Have the Highest Minimum Wage in America?
-

 AI2 weeks ago
Ranked: Semiconductor Companies by Industry Revenue Share
-

 Markets2 weeks ago
Ranked: The World’s Top Flight Routes, by Revenue
-

 Countries2 weeks ago
Population Projections: The World’s 6 Largest Countries in 2075
-

 Markets2 weeks ago
The Top 10 States by Real GDP Growth in 2023
-

 Demographics2 weeks ago
The Smallest Gender Wage Gaps in OECD Countries