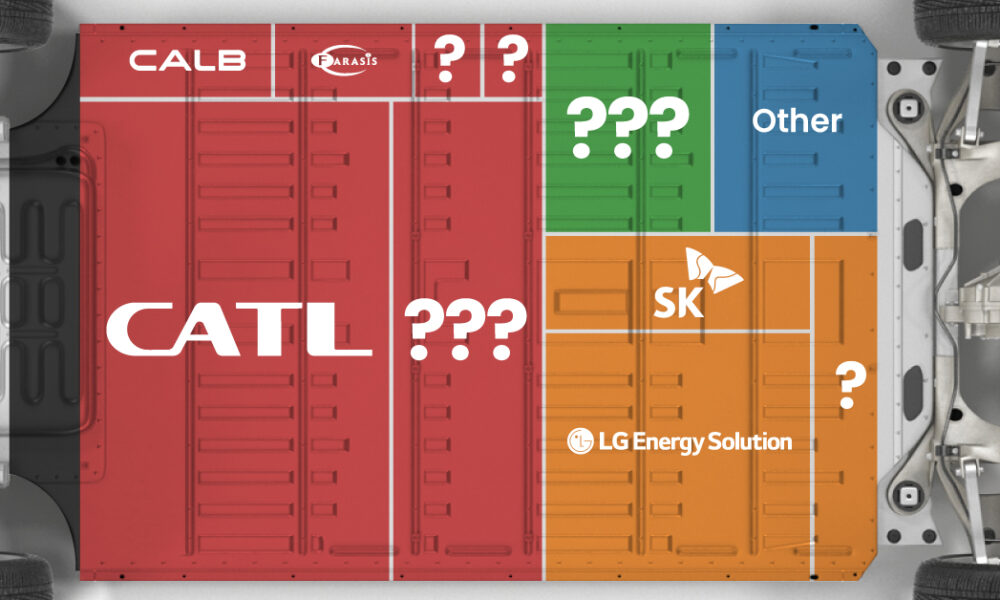
Asia dominates this ranking of the world's largest EV battery manufacturers in 2023.


This graphic shows why brass rods are the secure choice for precision-machined and forged parts.


The price of gold has set record highs in 2024, but how has this precious metal performed relative to the S&P 500?


While the price of gold has reached new record highs in 2024, gold mining stocks are still far from their 2011 peaks.


From airbags to firefighting equipment, components made from brass rods play a vital role in creating a safer environment.
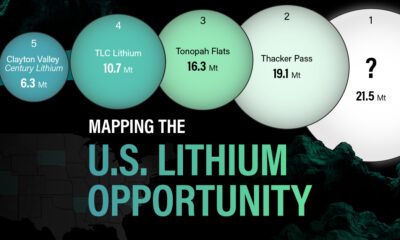

In this graphic, Visual Capitalist partnerered with EnergyX to explore the size and location of U.S. lithium mines.


We visualize the distribution of the world's uranium reserves by country, with 3 countries accounting for more than half of total reserves.
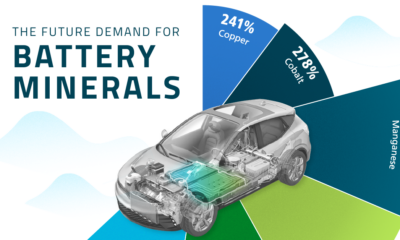

In this graphic, our sponsor Sprott examines the growth in demand for battery metals, as well as potential supply constraints.


Commodity returns in 2023 took a hit. This graphic shows the performance of commodities like gold, oil, nickel, and corn over the last decade.


The U.S. Geological Survey estimates that in 2022, China was the world’s leading producer of 30 out of 50 entries on the U.S. critical minerals list.


