Politics
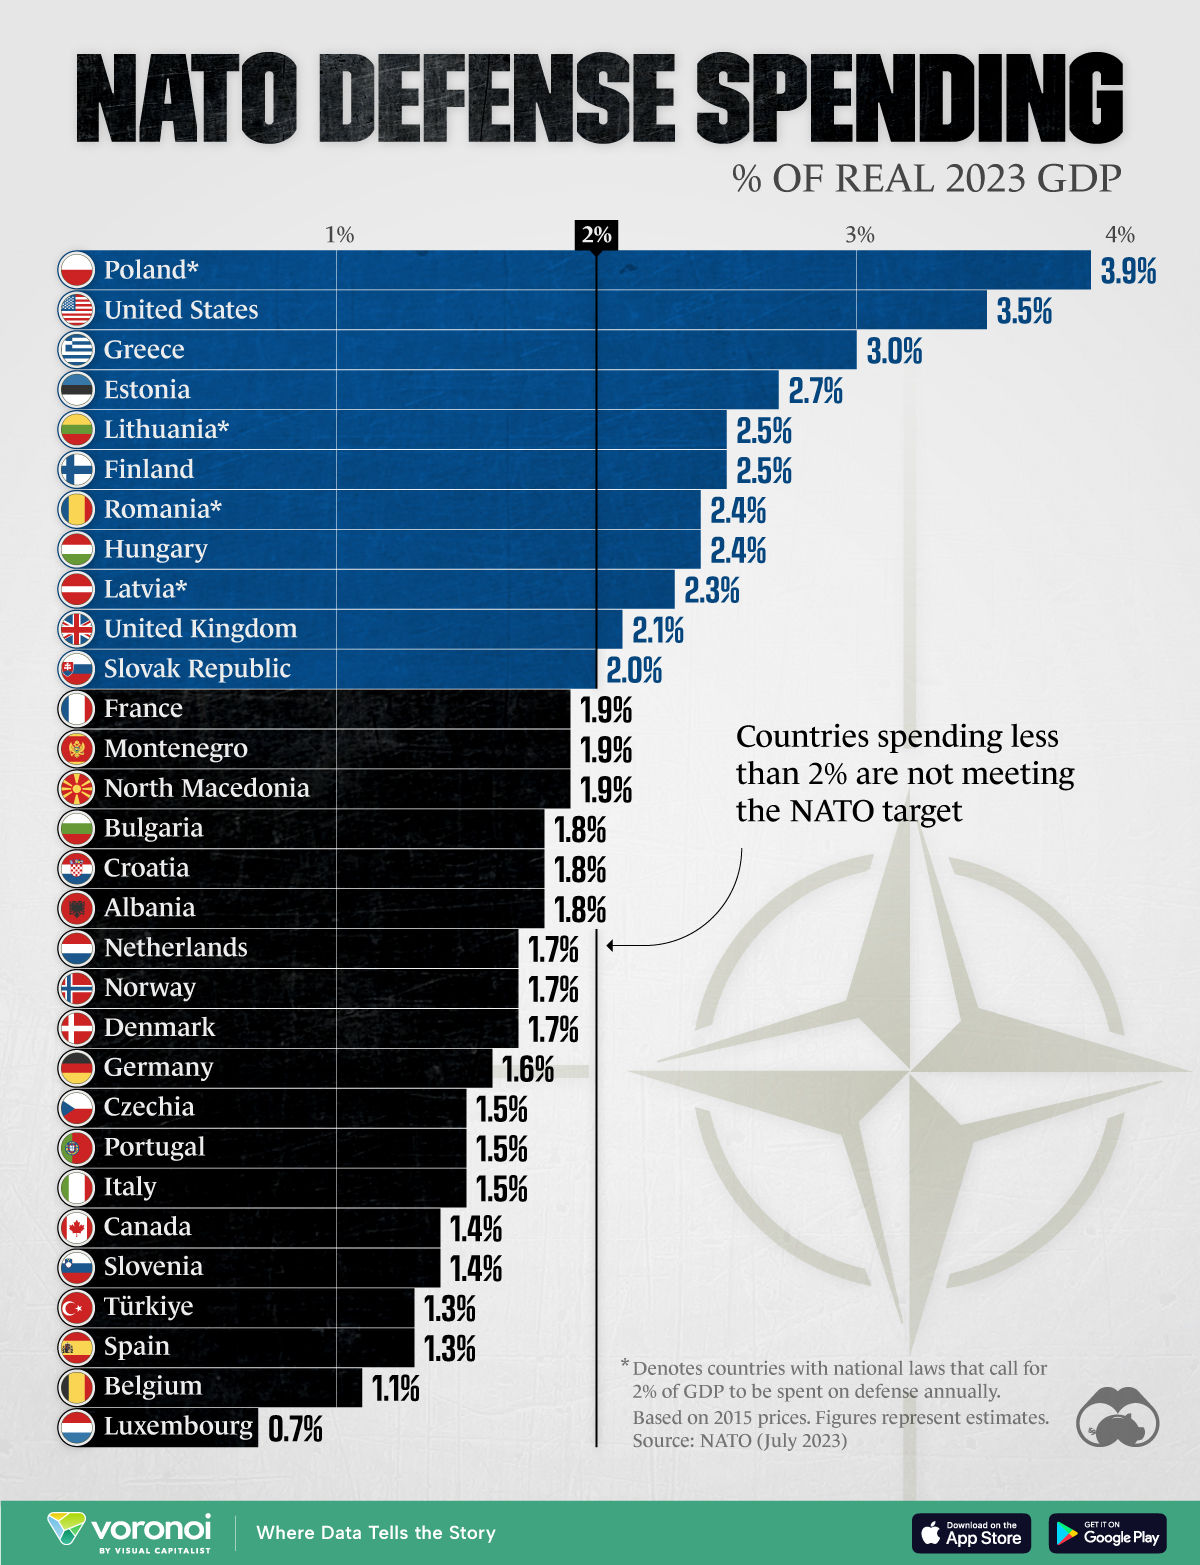
Which Countries Meet NATO’s Spending Target?
![]() See this visualization first on the Voronoi app.
See this visualization first on the Voronoi app.
Which Countries Meet NATO’s Spending Target?
This was originally posted on our Voronoi app. Download the app for free on iOS or Android and discover incredible data-driven charts from a variety of trusted sources.
In 2006, NATO defense ministers agreed that each member country would commit a minimum of 2% of its GDP to defense spending.
This graphic breaks down which members are keeping the agreement, based on data from NATO as of July 2023.
Poland Leads Ahead of the U.S.
The North Atlantic Treaty Organization (NATO) is a political and military alliance comprising 31 countries. Its primary purpose is to facilitate cooperation among member nations and ensure mutual defense and security.
In 2023, only 11 member countries were on track to meet NATO’s target of spending 2% of their country’s GDP on defense.
The U.S. accounted for 68% of the total defense expenditures by NATO countries, or $860 billion. This amount is over 10 times more than the second-placed country, Germany, if measured in absolute terms.
However, compared to the country’s GDP, the U.S. appears in second place with spending of 3.5% of GDP, behind Poland’s defense spending of $29.1 billion or 3.9% of GDP.
| Country | Defense spending in 2023E (% of GDP) |
|---|---|
| 🇵🇱 Poland* | 3.9 |
| 🇺🇸 United States | 3.5 |
| 🇬🇷 Greece | 3.0 |
| 🇪🇪 Estonia | 2.7 |
| 🇱🇹 Lithuania* | 2.5 |
| 🇫🇮 Finland | 2.5 |
| 🇷🇴 Romania* | 2.4 |
| 🇭🇺 Hungary | 2.4 |
| 🇱🇻 Latvia* | 2.3 |
| 🇬🇧 United Kingdom | 2.1 |
| 🇸🇰 Slovak Republic | 2.0 |
| 🇫🇷 France | 1.9 |
| 🇲🇪 Montenegro | 1.9 |
| 🇲🇰 North Macedonia | 1.9 |
| 🇧🇬 Bulgaria | 1.8 |
| 🇭🇷 Croatia | 1.8 |
| 🇦🇱 Albania | 1.8 |
| 🇳🇱 Netherlands | 1.7 |
| 🇳🇴 Norway | 1.7 |
| 🇩🇰 Denmark | 1.7 |
| 🇩🇪 Germany | 1.6 |
| 🇨🇿 Czechia | 1.5 |
| 🇵🇹 Portugal | 1.5 |
| 🇮🇹 Italy | 1.5 |
| 🇨🇦 Canada | 1.4 |
| 🇸🇮 Slovenia | 1.4 |
| 🇹🇷 Turkiye | 1.3 |
| 🇪🇸 Spain | 1.3 |
| 🇧🇪 Belgium | 1.1 |
| 🇱🇺 Luxembourg | 0.7 |
Situated in a crucial geopolitical location in Central Europe, Poland has increased its military spending in recent years, primarily due to concerns about escalating instability along the country’s eastern border with Belarus. According to polls, two-thirds of Poles hold a favorable opinion regarding NATO’s activities.
On the other hand, significant economic and military powers are among the members that are falling short. The list includes France (1.9%), Italy (1.5%), Canada (1.4%), and Germany (1.6%).
Despite being on the 2% list, the U.K. reduced the percentage spent in recent years from 2.14% in 2014 to an estimated 2.07% in 2023.


Politics
Charted: How Americans Feel About Federal Government Agencies
Fourteen of 16 federal government agencies garnered more favorable responses than unfavorable ones. But what were the outliers?
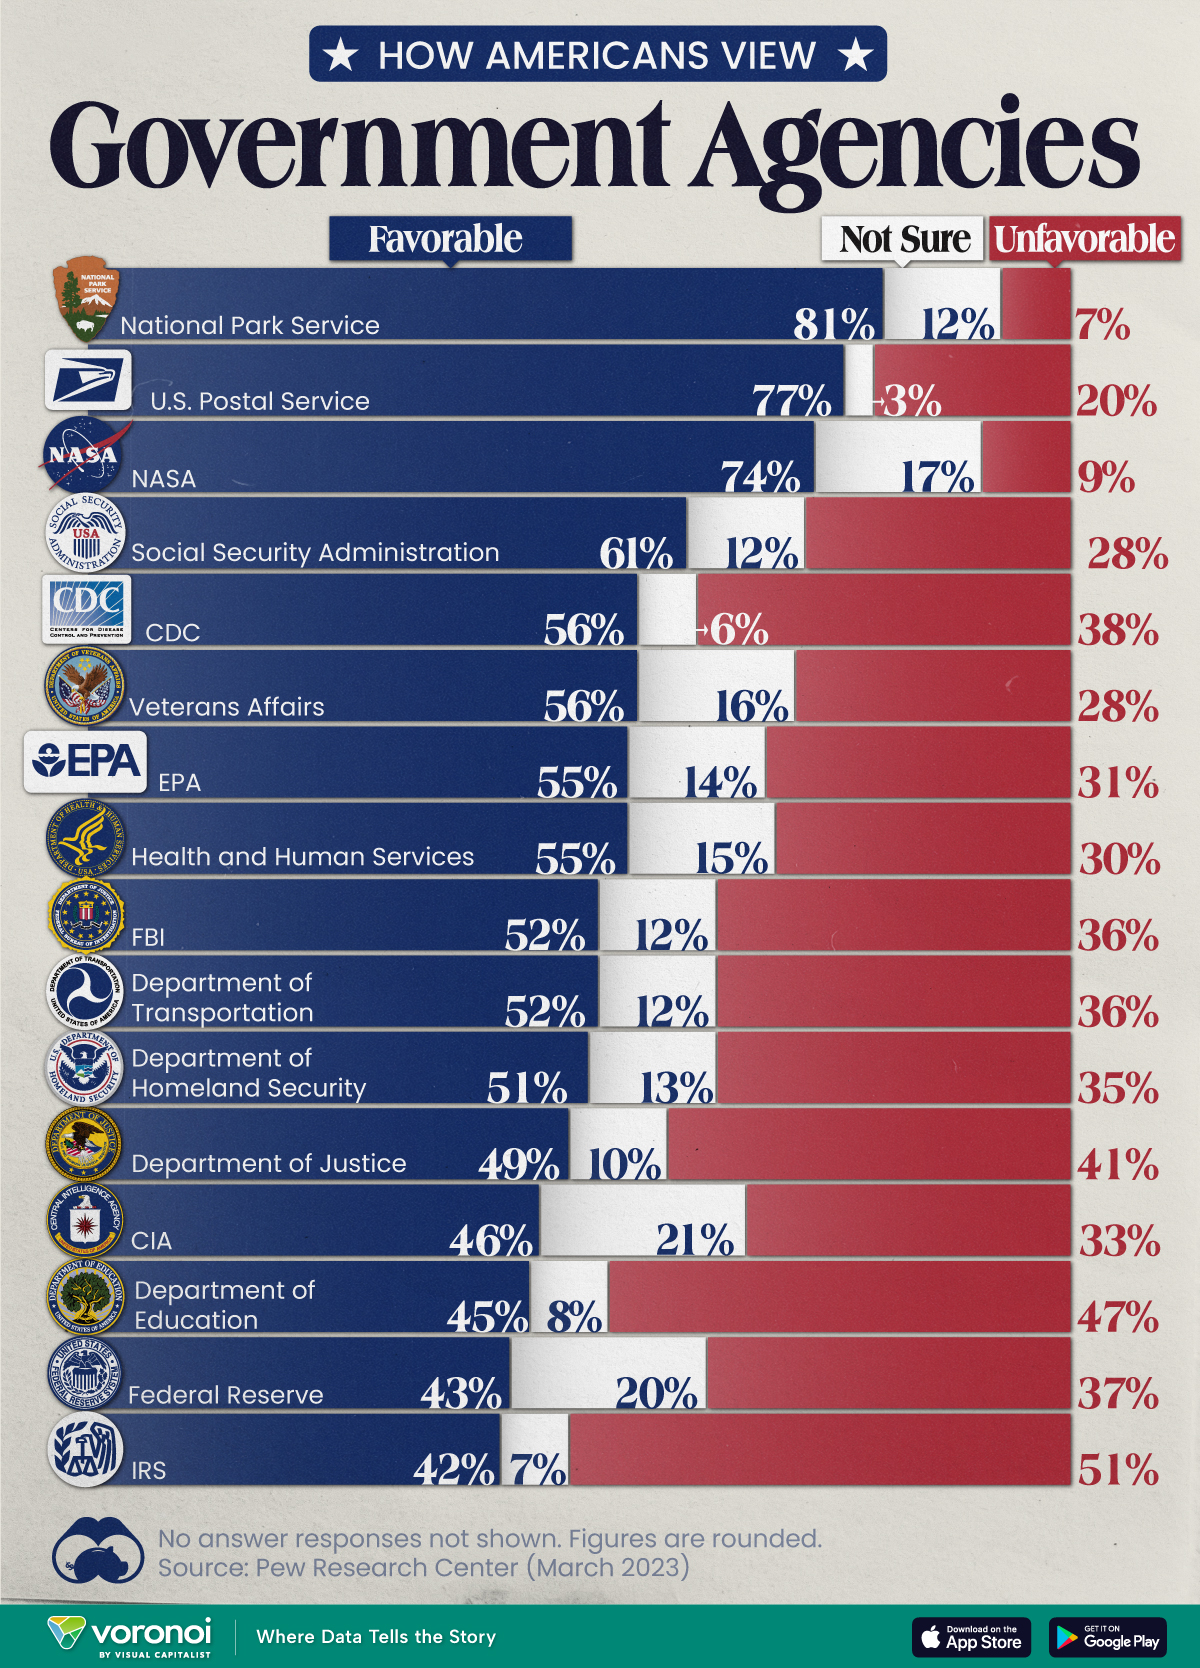

Chart: How Americans Rate 16 Federal Government Agencies
This was originally posted on our Voronoi app. Download the app for free on iOS or Android and discover incredible data-driven charts from a variety of trusted sources.
Come election time, America won’t hesitate to show its approval or disapproval of the country’s elected political representatives. That said, feelings about the federal bureaucracy and its associated agencies are a little harder to gauge.
We chart the results from an opinion poll conducted by Pew Research Center between March 13-19, 2023. In it, 10,701 adults—a representative of the U.S. adult population—were asked whether they felt favorably or unfavorably towards 16 different federal government agencies.
Americans Love the Park Service, Are Divided Over the IRS
Broadly speaking, 14 of the 16 federal government agencies garnered more favorable responses than unfavorable ones.
Of them, the Parks Service, Postal Service, and NASA all had the approval of more than 70% of the respondents.
| Agency | Favorable | Unfavorable | Not sure |
|---|---|---|---|
| 🏞️ National Park Service | 81% | 7% | 12% |
| 📮 U.S. Postal Service | 77% | 20% | 3% |
| 🚀 NASA | 74% | 9% | 17% |
| 💼 Social Security Administration | 61% | 28% | 12% |
| 🔬 CDC | 56% | 38% | 6% |
| 🎖️ Veterans Affairs | 56% | 28% | 16% |
| 🌿 EPA | 55% | 31% | 14% |
| 💉 Health & Human Services | 55% | 30% | 15% |
| 🕵️ FBI | 52% | 36% | 12% |
| 🚗 Department of Transportation | 52% | 36% | 12% |
| 🛡️ Department of Homeland Security | 51% | 35% | 13% |
| ⚖️ Department of Justice | 49% | 41% | 10% |
| 🕵️♂️ CIA | 46% | 33% | 21% |
| 📚 Department of Education | 45% | 47% | 8% |
| 💰 Federal Reserve | 43% | 37% | 20% |
| 💼 IRS | 42% | 51% | 7% |
Note: Figures are rounded. No answer responses are not shown.
Only the Department of Education and the IRS earned more unfavorable responses, and between them, only the IRS had a majority (51%) of unfavorable responses.
There are some caveats to remember with this data. Firstly, tax collection is a less-friendly activity than say, maintaining picturesque parks. Secondly, the survey was conducted a month before taxes were typically due, a peak time for experiencing filing woes.
Nevertheless, the IRS has come under fire in recent years. As per a New York Times article in 2019, eight years of budget cuts have stymied the agency’s ability to scrutinize tax filings from wealthier and more sophisticated filers.
At the same time poorer Americans are facing increasing audits on wage subsidies available to low income workers. According to a Transactional Records Access Clearinghouse report, this subset of filers was audited five-and-a-half more times the average American.

-

 Technology5 days ago
Mapped: The Number of AI Startups By Country
-

 Jobs2 weeks ago
The Best U.S. Companies to Work for According to LinkedIn
-

 Economy2 weeks ago
Ranked: The Top 20 Countries in Debt to China
-

 United States2 weeks ago
Charted: Trust in Government Institutions by G7 Countries
-

 Energy2 weeks ago
Mapped: The Age of Energy Projects in Interconnection Queues, by State
-

 Mining2 weeks ago
Visualizing Global Gold Production in 2023
-

 Markets1 week ago
Visualized: Interest Rate Forecasts for Advanced Economies
-

 Economy1 week ago
The Most Valuable Companies in Major EU Economies