VC+
What’s New on VC+ in July
If you’re a regular visitor to Visual Capitalist, you know that we’re your home base for data-driven, visual storytelling that helps explain a complex world.
But did you know there’s a way to get even more out of Visual Capitalist, all while helping support the work we do?
VC+ is our members program that gives you exclusive access to the weekly visual insights that leaders at Fortune 500 companies use to stay ahead.
Along with The Trendline newsletter twice a week and our monthly special dispatches, you’ll also get access to our VC+ Archive—unlocking hundreds of our in-depth briefings and insights in one place.
Here’s what VC+ members can look forward to for the rest of this month:
New to VC+ in July 2023
“Five Historical Maps and the Details That Make Them Fascinating”
SPECIAL DISPATCH: Exploring the World of Cartography Through the Lens of Design

In the pre-computer era, mapmaking was one of the most complex and challenging design endeavors.
In this special dispatch, we’ve handpicked five interesting maps for you to explore, from 19th century Egypt to WWII-era Tokyo. Along with each map, we’ll point out details to start you off in your journey of cartographic exploration.
Coming Monday, July 17th, 2023 (Get VC+ to access)
“Behind the Scenes of Voronoi: Building a Data Storytelling Platform”
SPECIAL DISPATCH: Exclusive Q&A With the VC Team On Insights From Our Upcoming App

At Visual Capitalist, we stand for a world where data can be better understood by everyone. In order to achieve this vision, we embarked on a journey back in 2022 to create the world’s first creator-centric, mobile data storytelling platform called Voronoi.
This special dispatch offers a look into the final stages of building our upcoming platform in an exclusive Q&A from the VC team, uncovering the development of new features along with release plans and more.
Coming Monday, July 24th, 2023 (Get VC+ to access)
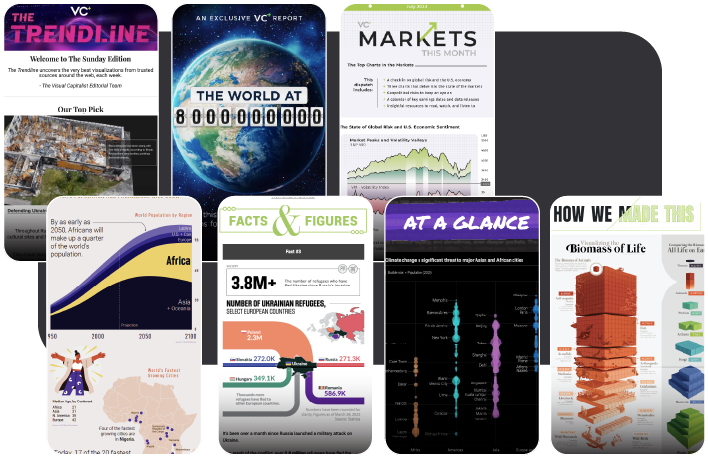
The Trendline
PREMIUM NEWSLETTER: Our Bi-Weekly Newsletter for VC+ Members
The Sunday Edition The Midweek Edition
The Best Visualizations Each Week The Best Data and Reports Each Week
>> View free sample >> View free sample
The Trendline is our premium newsletter sent to members twice a week.
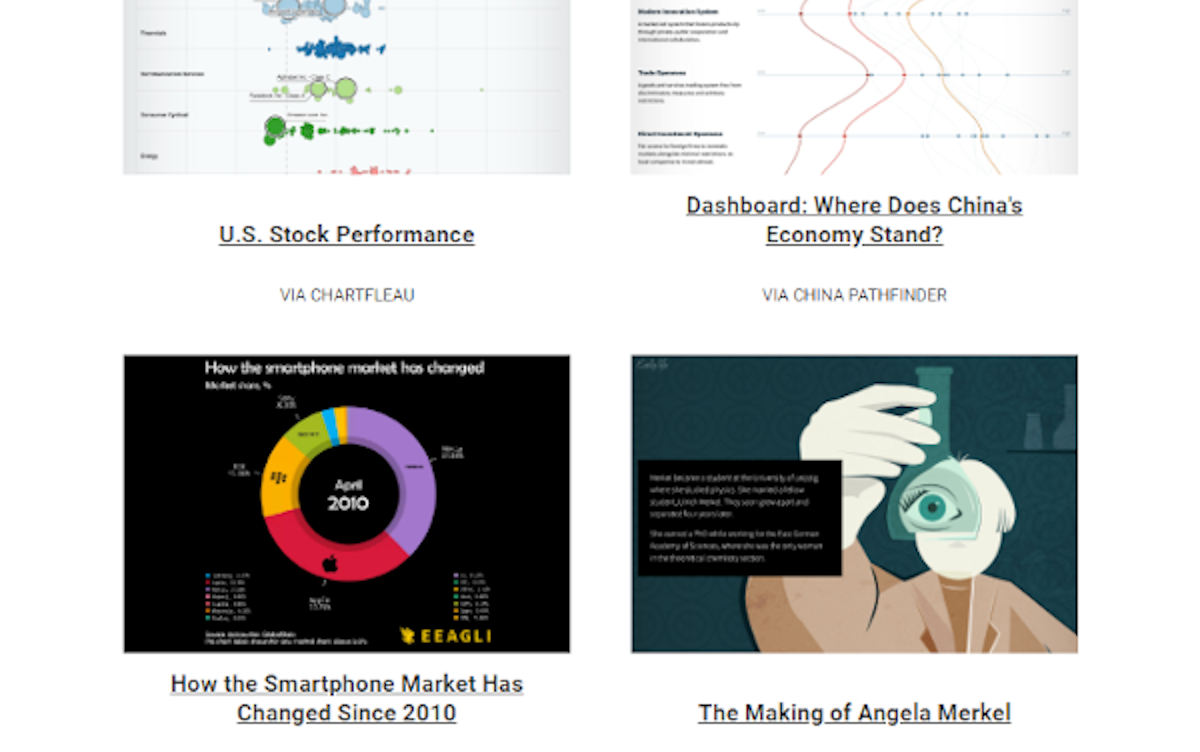
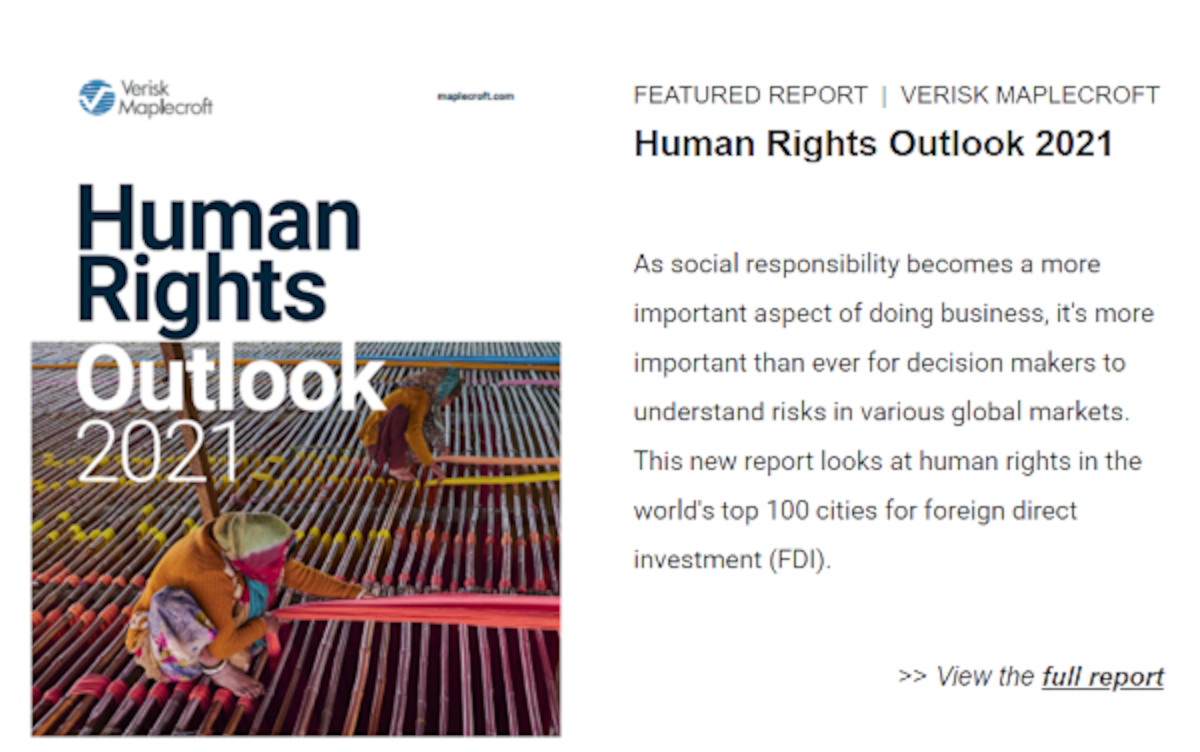
On Sundays, we highlight the best visualizations on business, investing, and global trends that our editors have uncovered. On Thursdays in the Midweek Edition, we send you a round-up of the most interesting reports we find along with key charts and commentary.
The Trends Shaping the World—in Your Inbox
Get access to these upcoming features by becoming a VC+ member. And for a limited time, get 25% off, which makes your VC+ membership the same price as a coffee each month:
PS – We look forward to sending you even more great visuals and data!


VC+
VC+: Get Our Key Takeaways From the IMF’s World Economic Outlook
A sneak preview of the exclusive VC+ Special Dispatch—your shortcut to understanding IMF’s World Economic Outlook report.

Have you read IMF’s latest World Economic Outlook yet? At a daunting 202 pages, we don’t blame you if it’s still on your to-do list.
But don’t worry, you don’t need to read the whole April release, because we’ve already done the hard work for you.
To save you time and effort, the Visual Capitalist team has compiled a visual analysis of everything you need to know from the report—and our VC+ Special Dispatch is available exclusively to VC+ members. All you need to do is log into the VC+ Archive.
If you’re not already subscribed to VC+, make sure you sign up now to access the full analysis of the IMF report, and more (we release similar deep dives every week).
For now, here’s what VC+ members get to see.
Your Shortcut to Understanding IMF’s World Economic Outlook
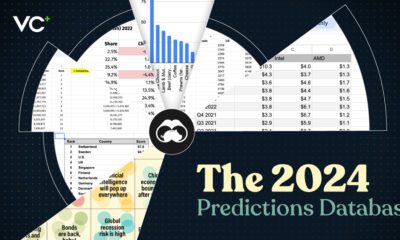
With long and short-term growth prospects declining for many countries around the world, this Special Dispatch offers a visual analysis of the key figures and takeaways from the IMF’s report including:
- The global decline in economic growth forecasts
- Real GDP growth and inflation forecasts for major nations in 2024
- When interest rate cuts will happen and interest rate forecasts
- How debt-to-GDP ratios have changed since 2000
- And much more!

Get the Full Breakdown in the Next VC+ Special Dispatch
VC+ members can access the full Special Dispatch by logging into the VC+ Archive, where you can also check out previous releases.
Make sure you join VC+ now to see exclusive charts and the full analysis of key takeaways from IMF’s World Economic Outlook.
Don’t miss out. Become a VC+ member today.
What You Get When You Become a VC+ Member
VC+ is Visual Capitalist’s premium subscription. As a member, you’ll get the following:
- Special Dispatches: Deep dive visual briefings on crucial reports and global trends
- Markets This Month: A snappy summary of the state of the markets and what to look out for
- The Trendline: Weekly curation of the best visualizations from across the globe
- Global Forecast Series: Our flagship annual report that covers everything you need to know related to the economy, markets, geopolitics, and the latest tech trends
- VC+ Archive: Hundreds of previously released VC+ briefings and reports that you’ve been missing out on, all in one dedicated hub
You can get all of the above, and more, by joining VC+ today.

-

 Science1 week ago
Visualizing the Average Lifespans of Mammals
-

 Demographics2 weeks ago
The Smallest Gender Wage Gaps in OECD Countries
-

 United States2 weeks ago
Where U.S. Inflation Hit the Hardest in March 2024
-

 Green2 weeks ago
Top Countries By Forest Growth Since 2001
-

 United States2 weeks ago
Ranked: The Largest U.S. Corporations by Number of Employees
-

 Maps2 weeks ago
The Largest Earthquakes in the New York Area (1970-2024)
-

 Green2 weeks ago
Ranked: The Countries With the Most Air Pollution in 2023
-

 Green2 weeks ago
Ranking the Top 15 Countries by Carbon Tax Revenue