

This month's VC+ special dispatches feature the insights from Knight Frank's latest flagship report and markets this month.
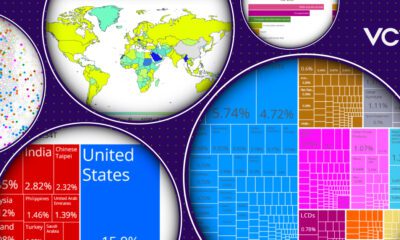

This month's VC+ special dispatches feature a visual exploration of top exporting nations and markets this month.
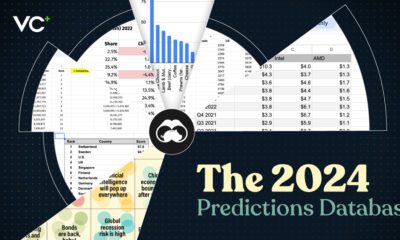

Dig into our database of 700+ game-changing predictions for the year ahead, as a new addition to the 2024 Global Forecast Series.

Explore our new report for the 2024 Global forecast Series with 50 pages of visual insights and 100+ predictions that will help you stay ahead in...

Here's a preview of our much-anticipated 2024 Global Forecast Series, the U.S. military's annual report on China and and much more.
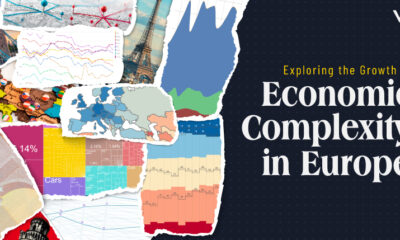

This month's VC+ special dispatches feature the economic complexity in Europe and markets this month.


This month's VC+ special dispatches feature a deep dive into BRICS’ history and markets this month.


Join VC+ Lifetime this month and get the best visual insights for the best value. See what else VC+ members receive in August!


This month's VC+ special dispatches feature an exploration of five historical maps and an exclusive Q&A with the VC Team on our upcoming app.


Join us June 14th for a new event by Visual Capitalist, exploring how the next generation of data creators are adapting to an increasingly mobile-first world.
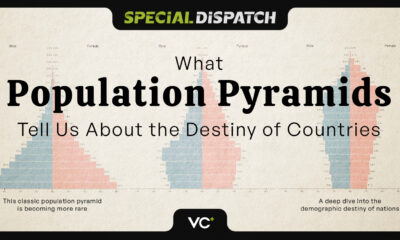

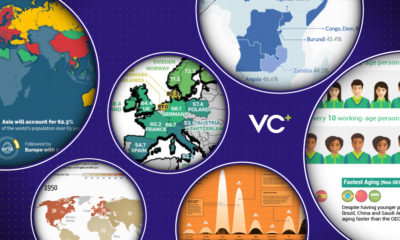
This month's VC+ special dispatches feature how country demographics shape economies and the May edition of Markets this Month.


Introducing the first challenge hosted by Visual Capitalist’s Creator Program! This is your chance to show-off your skills, impress the VC Editorial team, and win prizes.


To celebrate the launch of our VC+ archive, we're offering a bonus gift with the best visual insights. See what else VC+ members receive in April!


Get a jump start to your New Year with our Global Forecast series, the best online tools used by the VC team, and more.

We've doubled down on what makes VC+ great. See free samples while perusing what we have in store for the rest of November.

This month, we look at some of the top creators of data-driven visuals, while also tackling topics like climate change and an aging population.


This month, we unearth the best from VC Elements since launching our new channel, as well as topical news in charts.


This month, we uncover an exciting new AMA with our Creative and Art Directors, as well as topical news in charts.


This month, we dive into bonus content from our highly requested guide to data visualizations, as well as topical news in charts.


This month, we dive into bonus content for our new exploratory graphic on synthetic biology, as well as topical visualizations in the news.

Upcoming member features focus in on energy, prototyping ideas, the cannabis market — and of course, our weekly Trendline dispatch.


