Personal Finance
Visualizing $156 Trillion in U.S. Assets, by Generation


Visualizing U.S. Wealth by Generation
The distribution of wealth is an important measure of the economic power of each generation.
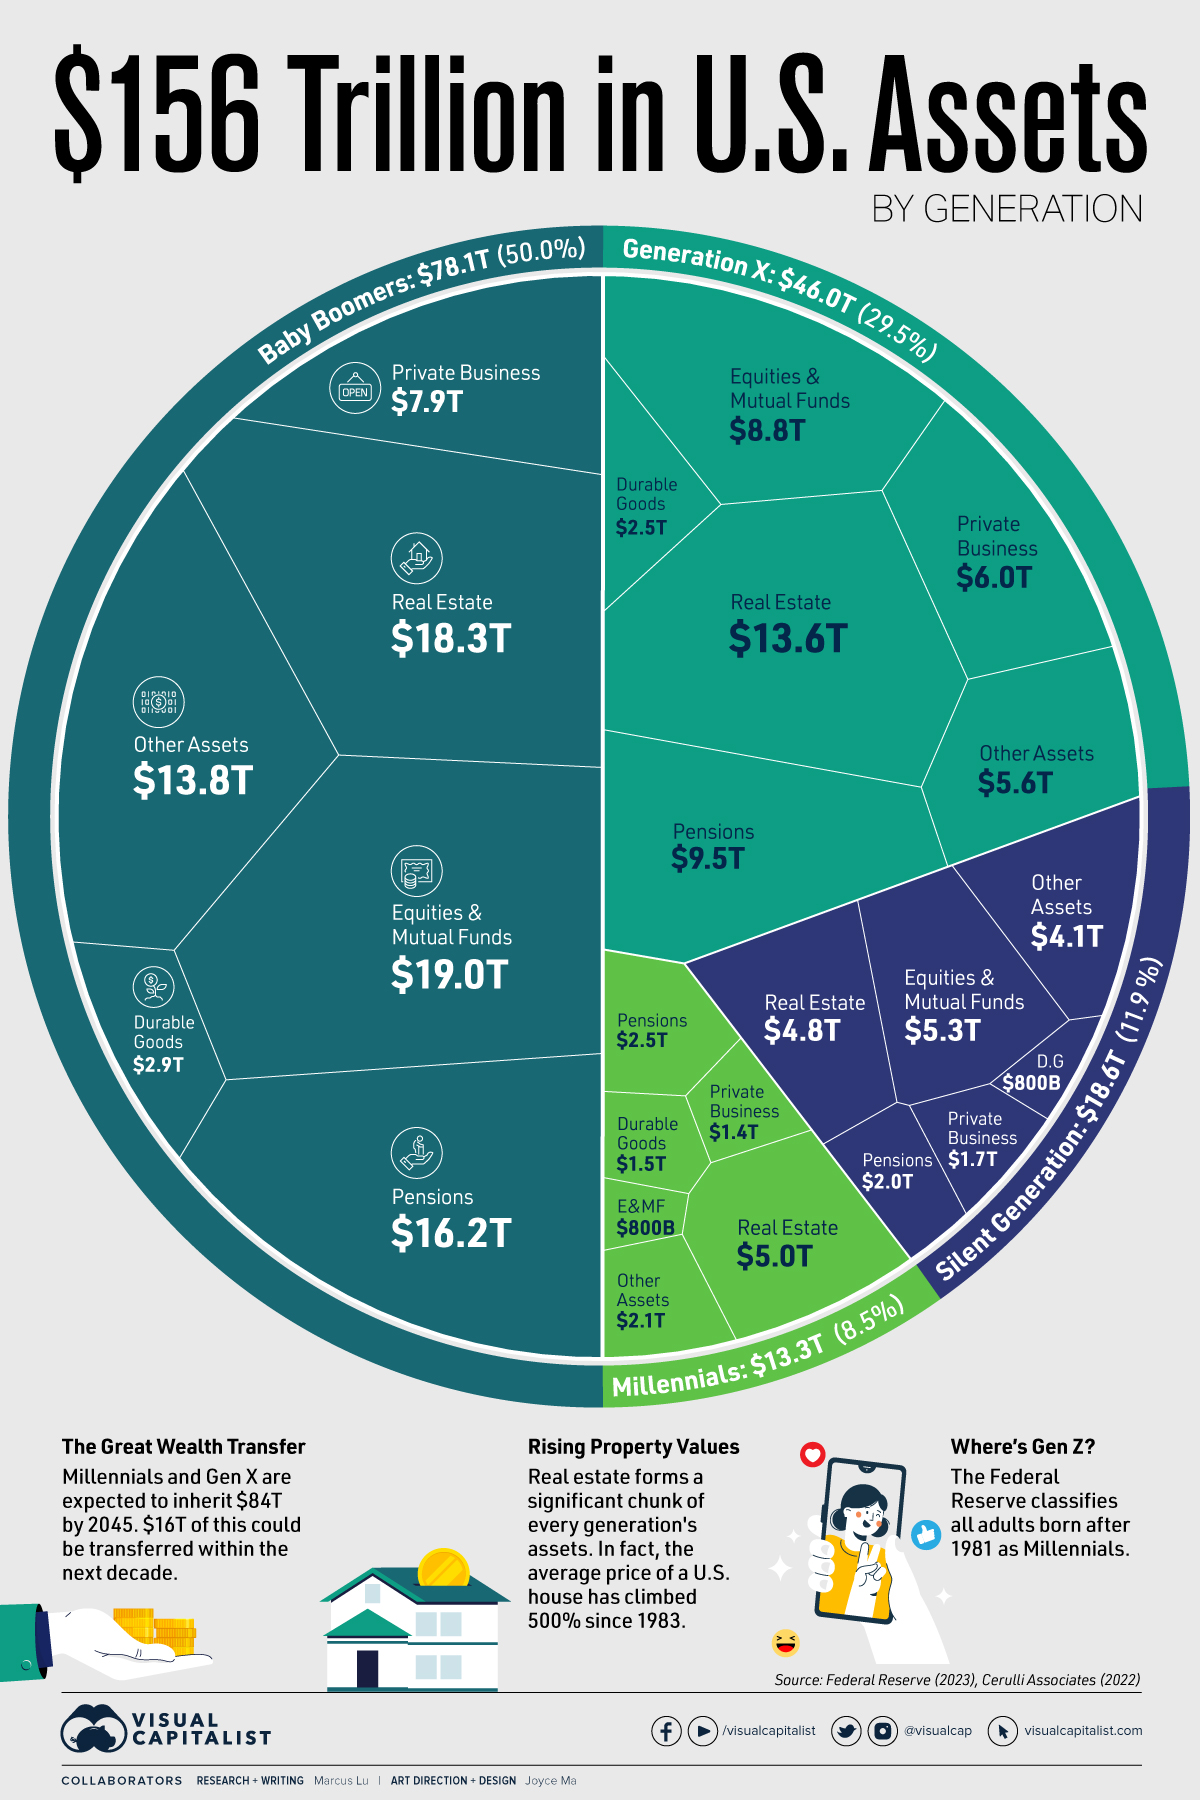
In the U.S., for example, baby boomers own half of the nation’s $156 trillion in assets despite making up 21% of the country’s population.
To learn more about U.S. wealth by generation, we’ve created two visualizations using Q4 2022 data from the Federal Reserve that break down both the assets and liabilities held by each American generation.
Assets by Generation
Assets by generation are listed in the table below. All figures are as of Q4 2022 and in USD trillions.
| Generation | Equities & Mutual Funds | Real Estate | Pensions | Private Businesses | Durable and Other Assets | Generation's Total Assets |
|---|---|---|---|---|---|---|
| Silent Generation | $5.3 | $4.8 | $2.0 | $1.7 | $4.9 | $18.6 |
| Baby Boomers | $19.0 | $18.3 | $16.2 | $7.9 | $16.7 | $78.1 |
| Generation X | $8.8 | $13.6 | $9.5 | $6.0 | $8.1 | $46.0 |
| Millennials | $0.8 | $5.0 | $2.5 | $1.4 | $3.6 | $13.3 |
| Totals | $33.8 | $41.8 | $30.1 | $17.1 | $33.3 | $156.0 |
Baby boomers’ biggest category of assets is Equities & Mutual Funds, where they own 56% of the national total. Millennials, on the other hand, represent just 2%.
Where millennials do have more wealth is Real Estate, with 12% of the national total. This suggests that millennials have, for the most part, foregone investing in financial assets in order to purchase a home.
Liabilities by Generation
The following charts show a breakdown of liabilities by generation. Not surprisingly, Mortgages make up the largest component of liabilities for all generations.
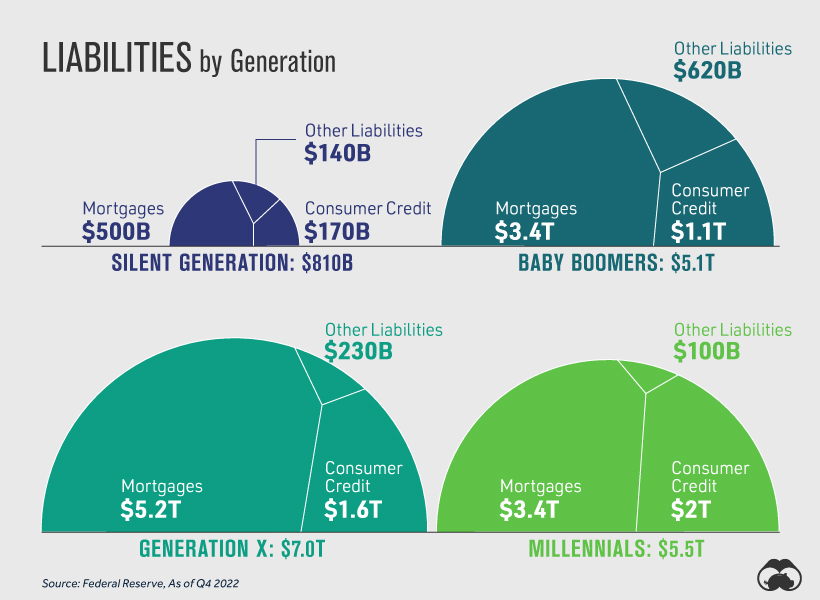
Something to highlight is that millennials are carrying the largest amount of Consumer Credit, at $2 trillion (representing about 43% of total consumer credit). As of 2022, millennials accounted for 22% of the U.S. population.
U.S. Wealth by Generation
Finally, we subtract liabilities from assets to arrive at total wealth by generation in the United States. Figures again are USD and in trillions.
| Generation | Assets | Liabilities | Wealth | Share of Wealth |
|---|---|---|---|---|
| Silent Generation | $18.6 | $0.8 | $17.8 | 13% |
| Baby Boomers | $78.1 | $5.1 | $73.0 | 53% |
| Generation X | $46.0 | $7.0 | $39.0 | 28% |
| Millennials | $13.3 | $5.5 | $7.8 | 6% |
| Totals | $156.0 | $18.4 | $137.6 | 100% |
As a final note, it’s worth highlighting that Gen Z is still too young to be included as a separate demographic in datasets like these. Born between 1997 and 2012, these individuals are currently between 11 and 26 years old. Interestingly, the Federal Reserve currently considers all U.S. adults born after 1981 as millennials.


Wealth
Visualizing the Tax Burden of Every U.S. State
Tax burden measures the percent of an individual’s income that is paid towards taxes. See where it’s the highest by state in this graphic.


Visualizing the Tax Burden of Every U.S. State
This was originally posted on our Voronoi app. Download the app for free on iOS or Android and discover incredible data-driven charts from a variety of trusted sources.
This map graphic visualizes the total tax burden in each U.S. state as of March 2024, based on figures compiled by WalletHub.
It’s important to understand that under this methodology, the tax burden measures the percent of an average person’s income that is paid towards state and local taxes. It considers property taxes, income taxes, and sales & excise tax.
Data and Methodology
The figures we used to create this graphic are listed in the table below.
| State | Total Tax Burden |
|---|---|
| New York | 12.0% |
| Hawaii | 11.8% |
| Vermont | 11.1% |
| Maine | 10.7% |
| California | 10.4% |
| Connecticut | 10.1% |
| Minnesota | 10.0% |
| Illinois | 9.7% |
| New Jersey | 9.5% |
| Rhode Island | 9.4% |
| Utah | 9.4% |
| Kansas | 9.3% |
| Maryland | 9.3% |
| Iowa | 9.2% |
| Nebraska | 9.2% |
| Ohio | 8.9% |
| Indiana | 8.9% |
| Arkansas | 8.8% |
| Mississippi | 8.8% |
| Massachusetts | 8.6% |
| Virginia | 8.5% |
| West Virginia | 8.5% |
| Oregon | 8.4% |
| Colorado | 8.4% |
| Pennsylvania | 8.4% |
| Wisconsin | 8.3% |
| Louisiana | 8.3% |
| Kentucky | 8.3% |
| Washington | 8.0% |
| New Mexico | 8.0% |
| Michigan | 8.0% |
| North Carolina | 7.9% |
| Idaho | 7.9% |
| Arizona | 7.8% |
| Missouri | 7.8% |
| Georgia | 7.7% |
| Texas | 7.6% |
| Alabama | 7.5% |
| Montana | 7.5% |
| South Carolina | 7.5% |
| Nevada | 7.4% |
| Oklahoma | 7.0% |
| North Dakota | 6.8% |
| South Dakota | 6.4% |
| Delaware | 6.4% |
| Tennessee | 6.1% |
| Florida | 6.1% |
| Wyoming | 5.7% |
| New Hampshire | 5.6% |
| Alaska | 4.9% |
From this data we can see that New York has the highest total tax burden. Residents in this state will pay, on average, 12% of their income to state and local governments.
Breaking this down into its three components, the average New Yorker pays 4.6% of their income on income taxes, 4.4% on property taxes, and 3% in sales & excise taxes.
At the other end of the spectrum, Alaska has the lowest tax burden of any state, equaling 4.9% of income. This is partly due to the fact that Alaskans do not pay state income tax.
Hate Paying Taxes?
In addition to Alaska, there are several other U.S. states that don’t charge income taxes. These are: Florida, Nevada, South Dakota, Tennessee, Texas, Washington, and Wyoming.
It’s also worth noting that New Hampshire does not have a regular income tax, but does charge a flat 4% on interest and dividend income according to the Tax Foundation.
Learn More About Taxation From Visual Capitalist
If you enjoyed this post, be sure to check out this graphic which ranks the countries with the lowest corporate tax rates, from 1980 to today.

-

 Energy4 days ago
Who’s Building the Most Solar Energy?
-

 Wealth2 weeks ago
Charted: Which Country Has the Most Billionaires in 2024?
-

 Markets2 weeks ago
The Top Private Equity Firms by Country
-

 Markets1 week ago
The Best U.S. Companies to Work for According to LinkedIn
-

 Economy1 week ago
Ranked: The Top 20 Countries in Debt to China
-

 Politics1 week ago
Charted: Trust in Government Institutions by G7 Countries
-

 Energy1 week ago
Mapped: The Age of Energy Projects in Interconnection Queues, by State
-

 Mining1 week ago
Visualizing Global Gold Production in 2023