Green
Top Countries By Forest Growth Since 2001
![]() See this visualization first on the Voronoi app.
See this visualization first on the Voronoi app.
Ranked: Top Countries By Forest Growth Since 2001
This was originally posted on our Voronoi app. Download the app for free on Apple or Android and discover incredible data-driven charts from a variety of trusted sources.
Reforestation is tricky business: it’s expensive, difficult to plan, and even harder to execute. And this is without all the associated environmental obstacles: weather, pests, and natural calamities.
However, some countries have prioritized replanting their lost forests, especially in the last two decades as the climate movement has gathered steam.
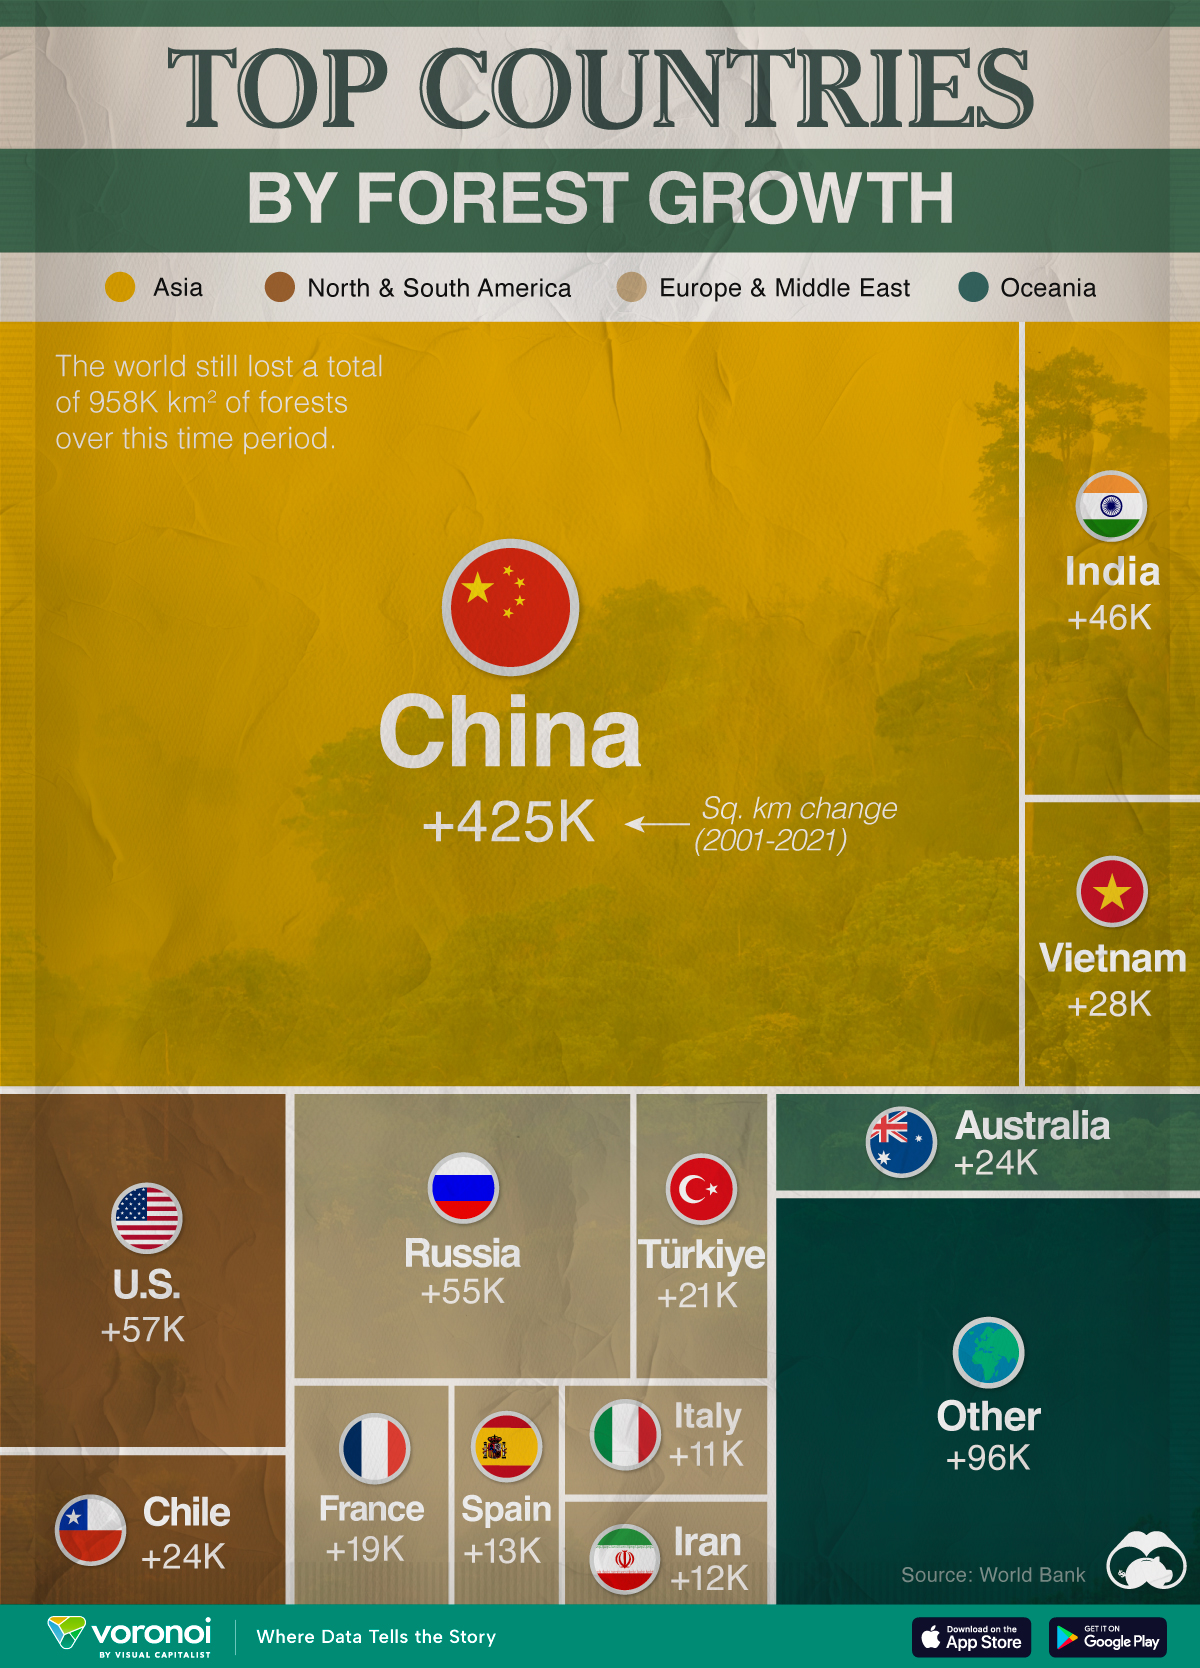
We visualized forest growth around the world, ranking countries by their forest area increases between 2001–2021, measured in square kilometers (km²).
All of this data was sourced from the World Bank. Note that countries are ranked by forest growth in square kilometers, rather than percentage change.
Which Country Leads Forest Growth Since 2001?
China tops the list, expanding its forest area by nearly 425,000 km2 (roughly the size of Sweden) between 2001–21. This is more than the next 19 countries combined. Relatively speaking, China’s forests increased by almost one-fourth.
| Rank | Country | Region | 2001–21 Change (Km2) | % of Forest Growth |
|---|---|---|---|---|
| 1 | 🇨🇳 China | Asia | 424,962 | 24% |
| 2 | 🇺🇸 U.S. | North America | 57,406 | 2% |
| 3 | 🇷🇺 Russia | Europe | 54,564 | 1% |
| 4 | 🇮🇳 India | Asia | 46,449 | 7% |
| 5 | 🇻🇳 Vietnam | Asia | 27,745 | 23% |
| 6 | 🇨🇱 Chile | South America | 24,257 | 15% |
| 7 | 🇦🇺 Australia | Oceania | 24,178 | 2% |
| 8 | 🇹🇷 Turkiye | Middle East | 21,345 | 11% |
| 9 | 🇫🇷 France | Europe | 19,353 | 13% |
| 10 | 🇪🇸 Spain | Europe | 13,374 | 8% |
| 11 | 🇮🇷 Iran | Middle East | 13,033 | 14% |
| 12 | 🇮🇹 Italy | Europe | 11,848 | 14% |
| 13 | 🇨🇺 Cuba | Central America | 7,573 | 30% |
| 14 | 🇹🇭 Thailand | Asia | 7,315 | 4% |
| 15 | 🇺🇿 Uzbekistan | Asia | 7,152 | 24% |
| 16 | 🇺🇾 Uruguay | South America | 6,468 | 46% |
| 17 | 🇷🇴 Romania | Europe | 5,482 | 9% |
| 18 | 🇧🇬 Bulgaria | Europe | 4,948 | 15% |
| 19 | 🇧🇾 Belarus | Europe | 4,734 | 6% |
| 20 | 🇵🇱 Poland | Europe | 4,090 | 5% |
| N/A | 🌍 World | -957,658 | -2% |
There are some other countries who have achieved similar relative levels of reforestation. Within Asia, Vietnam’s forests as a percentage of total land area have doubled since 1990. Since 2001, its forests have grown nearly 28,000 km², a 23% increase.
Uzbekistan similarly expanded its forested area by 24%, which amounts to about 7,000 km².
Meanwhile, Chile and Uruguay, are the only two South American countries that have managed to expand their forest cover in the last two decades—the latter by a staggering 46%. In contrast, the rest of South America is instead seeing significant deforestation.
It’s interesting to note that reforestation also comes with its own risks. Introducing non-native or monoculture tree species can reduce biodiversity and lead to soil erosion.
And despite global reforestation efforts, the world still lost close to a million square kilometers of forests since 2001.


Culture
How People Get Around in America, Europe, and Asia
Examining how people get around using cars, public transit, and walking or biking, and the regional differences in usage.


How People Get Around in America, Europe, and Asia
This was originally posted on our Voronoi app. Download the app for free on iOS or Android and discover incredible data-driven charts from a variety of trusted sources.
This chart highlights the popularity of different transportation types in the Americas, Europe, and Asia, calculated by modal share.
Data for this article and visualization is sourced from ‘The ABC of Mobility’, a research paper by Rafael Prieto-Curiel (Complexity Science Hub) and Juan P. Ospina (EAFIT University), accessed through ScienceDirect.
The authors gathered their modal share data through travel surveys, which focused on the primary mode of transportation a person employs for each weekday trip. Information from 800 cities across 61 countries was collected for this study.
North American Car Culture Contrasts with the Rest of the World
In the U.S. and Canada, people heavily rely on cars to get around, no matter the size of the city. There are a few exceptions of course, such as New York, Toronto, and smaller college towns across the United States.
| Region | 🚗 Cars | 🚌 Public Transport | 🚶 Walking/Biking |
|---|---|---|---|
| North America* | 92% | 5% | 4% |
| Central America | 23% | 42% | 35% |
| South America | 29% | 40% | 31% |
| Northern Europe | 48% | 29% | 24% |
| Western Europe | 43% | 24% | 34% |
| Southern Europe | 50% | 24% | 25% |
| Eastern Europe | 35% | 40% | 25% |
| Southeastern Asia | 44% | 43% | 13% |
| Western Asia | 43% | 28% | 29% |
| Southern Asia | 22% | 39% | 39% |
| Eastern Asia | 19% | 46% | 35% |
| World | 51% | 26% | 22% |
Note: *Excluding Mexico. Percentages are rounded.
As a result, North America’s share of public transport and active mobility (walking and biking) is the lowest amongst all surveyed regions by a significant amount.
On the other hand, public transport reigns supreme in South and Central America as well as Southern and Eastern Asia. It ties with cars in Southeastern Asia, and is eclipsed by cars in Western Asia.
As outlined in the paper, Europe sees more city-level differences in transport popularity.
For example, Utrecht, Netherlands prefers walking and biking. People in Paris and London like using their extensive transit systems. And in Manchester and Rome, roughly two out of three journeys are by car.

-

 United States5 days ago
Charted: What Southeast Asia Thinks About China & the U.S.
-

 United States2 weeks ago
Visualizing the Most Common Pets in the U.S.
-

 Culture2 weeks ago
The World’s Top Media Franchises by All-Time Revenue
-

 voronoi1 week ago
Best Visualizations of April on the Voronoi App
-

 Wealth1 week ago
Charted: Which Country Has the Most Billionaires in 2024?
-

 Business1 week ago
The Top Private Equity Firms by Country
-

 Markets1 week ago
The Best U.S. Companies to Work for According to LinkedIn
-

 Economy1 week ago
Ranked: The Top 20 Countries in Debt to China