Sponsored
Three Emerging Trends in the Space Industry
The following content is sponsored by MSCI
Three Emerging Trends in the Space Industry
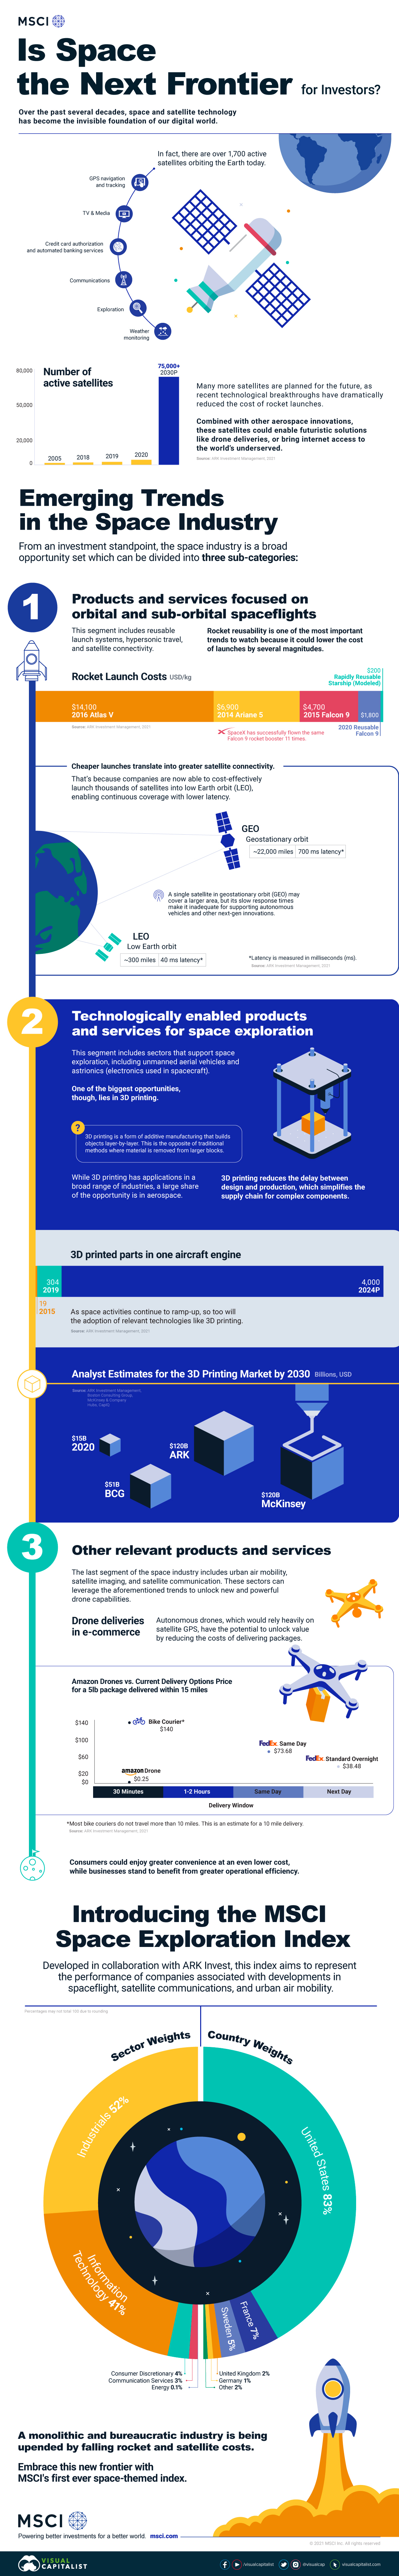
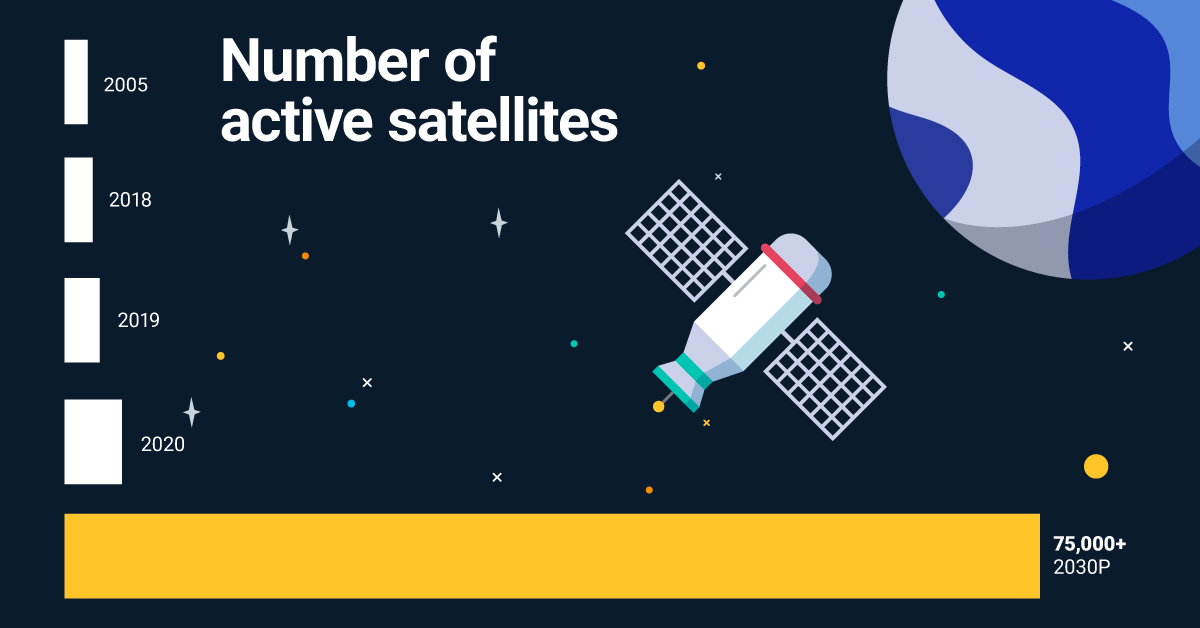
Over the past several decades, space and satellite technology has become the invisible foundation of our digital world. 1,700 active satellites are currently orbiting the Earth, and together, they enable many of the technologies we use on a daily basis.
Looking forward, this industry is on the cusp of a significant ramp-up. Recent technological breakthroughs have drastically reduced the cost of rocket launches, and by 2030, analysts expect the number of active satellites to increase by several magnitudes.
Greater satellite coverage is significant because it could unlock futuristic solutions like drone deliveries, or bring internet access to the world’s underserved. To help you learn more, this infographic from MSCI provides an overview of the entire space opportunity.
Emerging Trends in the Space Industry
The space industry is a broad opportunity set which can be divided into three segments.
#1: Products and services focused on orbital and sub-orbital spaceflights
This segment includes reusable launch systems, hypersonic travel, and satellite connectivity. Rocket reusability has the greatest potential because it could greatly lower the cost of launches going forward.
This table lists rocket launch costs in terms of USD/kg.
Rocket | Manufacturer | Cost (USD/kg) |
---|---|---|
2016 Atlas V | United Launch Alliance (ULA)* | $14,100 |
2014 Ariane 5 | Airbus | $6,900 |
2015 Falcon 9 | SpaceX | $4,700 |
2020 Reusable Falcon 9 | SpaceX | $1,800 |
Rapidly Reusable Starship | Theoretical model based on ARK estimates | $200 |
*Joint venture between Lockheed Martin and Boeing. Source: ARK Investment Management (2021)
Rocket reusability can significantly drive down costs and allow companies to cost-effectively launch thousands of satellites into low Earth orbit (LEO). LEO refers to an altitude of 100 to 1,200 miles, as opposed to geostationary orbit (GEO) which has an altitude of roughly 22,000 miles.
The primary benefit of LEO satellites is that they have a much lower latency (delay measured in milliseconds) as opposed to GEO satellites. The drawback of LEO is that each satellite covers a much smaller area of the Earth, though as stated above, the ability to launch many satellites at relatively low cost negates this problem.
#2: Technologically enabled products and services for space exploration
This segment includes sectors that support space exploration, including unmanned aerial vehicles and astrionics (electronics used in spacecraft).
An important technology within this sector is 3D printing, which is a form of additive manufacturing that builds objects layer-by-layer. While still a relatively new technology, the use of 3D printing within the space industry is growing.
This table lists the number of 3D printed parts that are found in one aircraft engine.
Year | Number of 3D printed parts in one engine |
---|---|
2015 | 19 |
2019 | 304 |
2024 (projection) | 4000 |
Source: ARK Investment Management (2021)
Increasing activities in space are likely to create downstream benefits for the 3D printing industry. Analysts believe the industry could be worth $120 billion in 2030, up from $15 billion in 2020.
#3: Other relevant products and services
This final segment includes urban air mobility, satellite imaging, and satellite communication. Decreasing rocket launch costs will be a significant catalyst for these sectors.
One area of focus is autonomous drones, which would rely heavily on satellite GPS. These drones could unlock value for ecommerce businesses by reducing the cost of deliveries.
Delivery method | Delivery window | Price for a 5lb package |
---|---|---|
FedEx Standard Overnight | Next day | $38.48 |
FedEx Same Day | Same day | $73.68 |
Bike Courier* | 1-2 hours | $140 |
Amazon Drone (projection) | 30 minutes | $0.25 |
*Most bike couriers do not travel more than 10 miles. This estimate is for a 10 mile delivery.
Source: ARK Investment Management (2021)
The potential cost savings from drone deliveries would benefit businesses, by way of larger margins, as well as consumers, through better convenience.
Introducing the MSCI Space Exploration Index
The MSCI Space Exploration Index was developed in collaboration with ARK Invest, and aims to represent the performance of companies associated with the developments in spaceflight, satellite communications, and urban air mobility.
Sector | Index Weight (%) |
---|---|
Industrials | 52% |
Information Technology | 41% |
Consumer Discretionary | 4% |
Communication Services | 3% |
Energy | 0.1% |
Percentages may not total 100 due to rounding.
Source: MSCI
A monolithic and bureaucratic industry is being upended by falling rocket and satellite costs. Embrace this new frontier with MSCI’s first ever space-themed index.
Sponsored
Ranked: Emissions per Capita of the Top 30 U.S. Investor-Owned Utilities
Roughly 25% of all GHG emissions come from electricity production. See how the top 30 IOUs rank by emissions per capita.

Emissions per Capita of the Top 30 U.S. Investor-Owned Utilities
Approximately 25% of all U.S. greenhouse gas emissions (GHG) come from electricity generation.
Subsequently, this means investor-owned utilities (IOUs) will have a crucial role to play around carbon reduction initiatives. This is particularly true for the top 30 IOUs, where almost 75% of utility customers get their electricity from.
This infographic from the National Public Utilities Council ranks the largest IOUs by emissions per capita. By accounting for the varying customer bases they serve, we get a more accurate look at their green energy practices. Here’s how they line up.
Per Capita Rankings
The emissions per capita rankings for the top 30 investor-owned utilities have large disparities from one another.
Totals range from a high of 25.8 tons of CO2 per customer annually to a low of 0.5 tons.
Utility | Emissions Per Capita (CO2 tons per year) | Total Emissions (M) |
---|---|---|
TransAlta | 25.8 | 16.3 |
Vistra | 22.4 | 97.0 |
OGE Energy | 21.5 | 18.2 |
AES Corporation | 19.8 | 49.9 |
Southern Company | 18.0 | 77.8 |
Evergy | 14.6 | 23.6 |
Alliant Energy | 14.4 | 14.1 |
DTE Energy | 14.2 | 29.0 |
Berkshire Hathaway Energy | 14.0 | 57.2 |
Entergy | 13.8 | 40.5 |
WEC Energy | 13.5 | 22.2 |
Ameren | 12.8 | 31.6 |
Duke Energy | 12.0 | 96.6 |
Xcel Energy | 11.9 | 43.3 |
Dominion Energy | 11.0 | 37.8 |
Emera | 11.0 | 16.6 |
PNM Resources | 10.5 | 5.6 |
PPL Corporation | 10.4 | 28.7 |
American Electric Power | 9.2 | 50.9 |
Consumers Energy | 8.7 | 16.1 |
NRG Energy | 8.2 | 29.8 |
Florida Power and Light | 8.0 | 41.0 |
Portland General Electric | 7.6 | 6.9 |
Fortis Inc. | 6.1 | 12.6 |
Avangrid | 5.1 | 11.6 |
PSEG | 3.9 | 9.0 |
Exelon | 3.8 | 34.0 |
Consolidated Edison | 1.6 | 6.3 |
Pacific Gas and Electric | 0.5 | 2.6 |
Next Era Energy Resources | 0 | 1.1 |
PNM Resources data is from 2019, all other data is as of 2020
Let’s start by looking at the higher scoring IOUs.
TransAlta
TransAlta emits 25.8 tons of CO2 emissions per customer, the largest of any utility on a per capita basis. Altogether, the company’s 630,000 customers emit 16.3 million metric tons. On a recent earnings call, its management discussed clear intent to phase out coal and grow their renewables mix by doubling their renewables fleet. And so far it appears they’ve been making good on their promise, having shut down the Canadian Highvale coal mine recently.
Vistra
Vistra had the highest total emissions at 97 million tons of CO2 per year and is almost exclusively a coal and gas generator. However, the company announced plans for 60% reductions in CO2 emissions by 2030 and is striving to be carbon neutral by 2050. As the highest total emitter, this transition would make a noticeable impact on total utility emissions if successful.
Currently, based on their 4.3 million customers, Vistra sees per capita emissions of 22.4 tons a year. The utility is a key electricity provider for Texas, ad here’s how their electricity mix compares to that of the state as a whole:
Energy Source | Vistra | State of Texas |
---|---|---|
Gas | 63% | 52% |
Coal | 29% | 15% |
Nuclear | 6% | 9% |
Renewables | 1% | 24% |
Oil | 1% | 0% |
Despite their ambitious green energy pledges, for now only 1% of Vistra’s electricity comes from renewables compared to 24% for Texas, where wind energy is prospering.
Based on those scores, the average customer from some of the highest emitting utility groups emit about the same as a customer from each of the bottom seven, who clearly have greener energy practices. Let’s take a closer look at emissions for some of the bottom scoring entities.
Utilities With The Greenest Energy Practices
Groups with the lowest carbon emission scores are in many ways leaders on the path towards a greener future.
Exelon
Exelon emits only 3.8 tons of CO2 emissions per capita annually and is one of the top clean power generators across the Americas. In the last decade they’ve reduced their GHG emissions by 18 million metric tons, and have recently teamed up with the state of Illinois through the Clean Energy Jobs Act. Through this, Exelon will receive $700 million in subsidies as it phases out coal and gas plants to meet 2030 and 2045 targets.
Consolidated Edison
Consolidated Edison serves nearly 4 million customers with a large chunk coming from New York state. Altogether, they emit 1.6 tons of CO2 emissions per capita from their electricity generation.
The utility group is making notable strides towards a sustainable future by expanding its renewable projects and testing higher capacity limits. In addition, they are often praised for their financial management and carry the title of dividend aristocrat, having increased their dividend for 47 years and counting. In fact, this is the longest out of any utility company in the S&P 500.
A Sustainable Tomorrow
Altogether, utilities will have a pivotal role to play in decarbonization efforts. This is particularly true for the top 30 U.S. IOUs, who collectively serve 60 million Americans, or one-fifth of the U.S. population.
Ultimately, this means a unique moment for utilities is emerging. As the transition toward cleaner energy continues and various groups push to achieve their goals, all eyes will be on utilities to deliver.
The National Public Utilities Council is the go-to resource to learn how utilities can lead in the path towards decarbonization.
Sponsored
The Road to Decarbonization: How Asphalt is Affecting the Planet
The U.S. alone generates ∼12 million tons of asphalt shingles tear-off waste and installation scrap every year and more than 90% of it is dumped into landfills.

The Road to Decarbonization: How Asphalt is Affecting the Planet
Asphalt, also known as bitumen, has various applications in the modern economy, with annual demand reaching 110 million tons globally.
Until the 20th century, natural asphalt made from decomposed plants accounted for the majority of asphalt production. Today, most asphalt is refined from crude oil.
This graphic, sponsored by Northstar Clean Technologies, shows how new technologies to reuse and recycle asphalt can help protect the environment.
The Impact of Climate Change
Pollution from vehicles is expected to decline as electric vehicles replace internal combustion engines.
But pollution from asphalt could actually increase in the next decades because of rising temperatures in some parts of the Earth. When subjected to extreme temperatures, asphalt releases harmful greenhouse gases (GHG) into the atmosphere.
Emissions from Road Construction (Source) | CO2 equivalent (%) |
---|---|
Asphalt | 28% |
Concrete | 18% |
Excavators and Haulers | 16% |
Trucks | 13% |
Crushing Plant | 10% |
Galvanized Steel | 6% |
Reinforced Steel | 6% |
Plastic Piping | 2% |
Geotextile | 1% |
Asphalt paved surfaces and roofs make up approximately 45% and 20% of surfaces in U.S. cities, respectively. Furthermore, 75% of single-family detached homes in Canada and the U.S. have asphalt shingles on their roofs.
Reducing the Environmental Impact of Asphalt
Similar to roads, asphalt shingles have oil as the primary component, which is especially harmful to the environment.
Shingles do not decompose or biodegrade. The U.S. alone generates ∼12 million tons of asphalt shingles tear-off waste and installation scrap every year and more than 90% of it is dumped into landfills, the equivalent of 20 million barrels of oil.
But most of it can be reused, rather than taking up valuable landfill space.
Using technology, the primary components in shingles can be repurposed into liquid asphalt, aggregate, and fiber, for use in road construction, embankments, and new shingles.
Providing the construction industry with clean, sustainable processing solutions is also a big business opportunity. Canada alone is a $1.3 billion market for recovering and reprocessing shingles.
Northstar Clean Technologies is the only public company that repurposes 99% of asphalt shingles components that otherwise go to landfills.
-
Misc5 days ago
The Top 10 Largest Nuclear Explosions, Visualized
-
Technology3 weeks ago
How Do Big Tech Giants Make Their Billions?
-
Green4 weeks ago
Visualizing All Electric Car Models Available in the U.S.
-
Markets4 weeks ago
Satellite Maps: Shanghai’s Supply Chain Standstill
-
Energy1 week ago
Mapped: Solar and Wind Power by Country
-
Datastream3 weeks ago
Visualizing Companies with the Most Patents Granted in 2021
-
Technology1 week ago
Synthetic Biology: The $3.6 Trillion Science Changing Life as We Know It
-
Markets3 weeks ago
Why Investors Tuned Out Netflix