Money
The World’s “Hot” Money [Chart]
The World’s “Hot” Money [Chart]
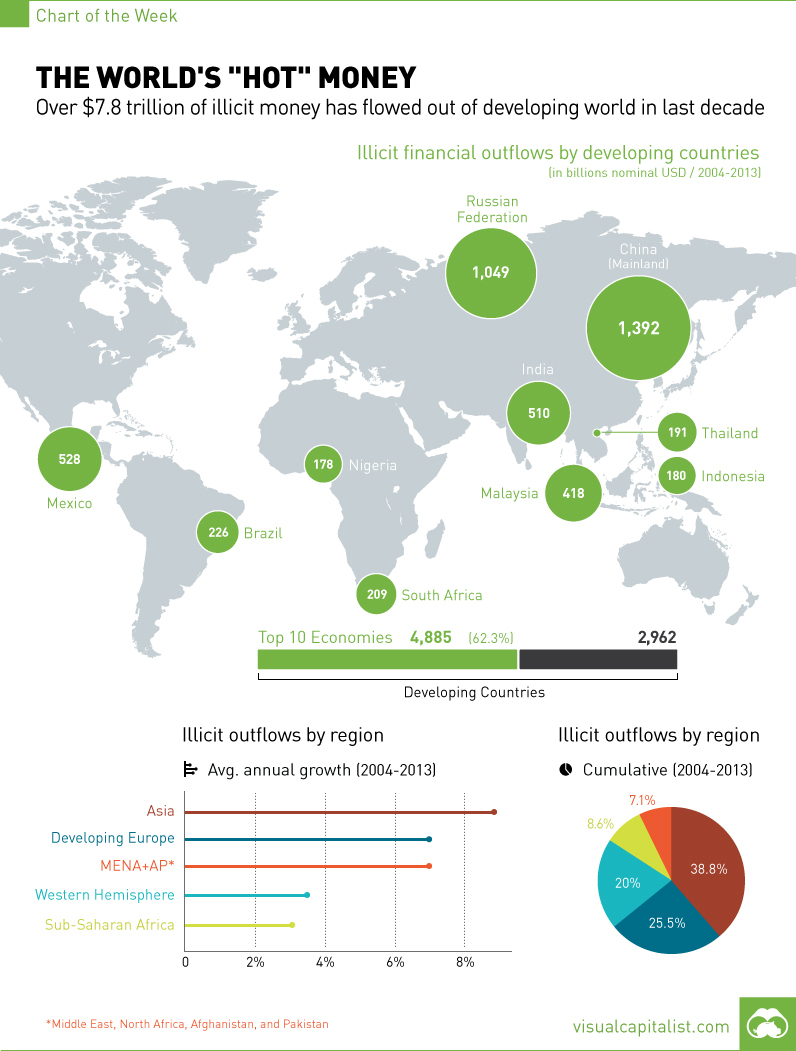
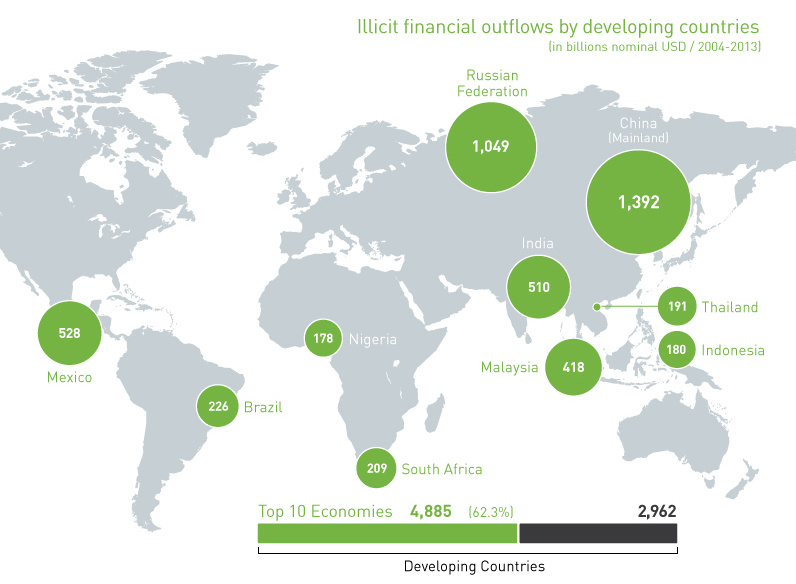
Over $7.8 trillion of illicit money has flowed out of developing countries in last decade
The Chart of the Week is a weekly Visual Capitalist feature on Fridays.
Every year, roughly $1 trillion flows illegally out of developing and emerging economies due to crime, corruption, and tax evasion. This amount is more than these countries receive in foreign direct investment and foreign aid combined.
This week, a new report was released that highlights the latest data available on this “hot” money. Assembled by Global Financial Integrity, a research and advisory organization based in Washington, DC, the report details illicit financial flows of money from developing countries using the latest information available, which is up until the end of 2013.
The cumulative amount of this “hot money” coming out of developing countries totaled just over $7.8 trillion between 2004 and 2013. On an annual basis, it breached the $1 trillion mark each of the last three years of data available, which is good for a growth rate of 6.5% rate annually.
In Asia, illicit financial outflows are growing even quicker at an 8.6% clip. It’s also on the continent that five of the ten largest source economies for these flows can be found, including the largest offender, which is Mainland China.
How does this “hot” money leave these countries? Global Financial Integrity has calculated that 83% of illicit financial flows are due to what it calls “trade misinvoicing”.
It’s defined as the following:
The misinvoicing of trade is accomplished by misstating the value or volume of an export or import on a customs invoice. Trade misinvoicing is a form of trade-based money laundering made possible by the fact that trading partners write their own trade documents, or arrange to have the documents prepared in a third country (typically a tax haven), a method known as re-invoicing. Fraudulent manipulation of the price, quantity, or quality of a good or service on an invoice allows criminals, corrupt government officials, and commercial tax evaders to shift vast amounts of money across international borders quickly, easily, and nearly always undetected.
Trade misinvoicing accounted for an average of $654.7 billion per year of lost trade in developing markets over the data set covered by the report.


Money
Charted: Which City Has the Most Billionaires in 2024?
Just two countries account for half of the top 20 cities with the most billionaires. And the majority of the other half are found in Asia.


Charted: Which Country Has the Most Billionaires in 2024?
This was originally posted on our Voronoi app. Download the app for free on iOS or Android and discover incredible data-driven charts from a variety of trusted sources.
Some cities seem to attract the rich. Take New York City for example, which has 340,000 high-net-worth residents with investable assets of more than $1 million.
But there’s a vast difference between being a millionaire and a billionaire. So where do the richest of them all live?
Using data from the Hurun Global Rich List 2024, we rank the top 20 cities with the highest number of billionaires in 2024.
A caveat to these rich lists: sources often vary on figures and exact rankings. For example, in last year’s reports, Forbes had New York as the city with the most billionaires, while the Hurun Global Rich List placed Beijing at the top spot.
Ranked: Top 20 Cities with the Most Billionaires in 2024
The Chinese economy’s doldrums over the course of the past year have affected its ultra-wealthy residents in key cities.
Beijing, the city with the most billionaires in 2023, has not only ceded its spot to New York, but has dropped to #4, overtaken by London and Mumbai.
| Rank | City | Billionaires | Rank Change YoY |
|---|---|---|---|
| 1 | 🇺🇸 New York | 119 | +1 |
| 2 | 🇬🇧 London | 97 | +3 |
| 3 | 🇮🇳 Mumbai | 92 | +4 |
| 4 | 🇨🇳 Beijing | 91 | -3 |
| 5 | 🇨🇳 Shanghai | 87 | -2 |
| 6 | 🇨🇳 Shenzhen | 84 | -2 |
| 7 | 🇭🇰 Hong Kong | 65 | -1 |
| 8 | 🇷🇺 Moscow | 59 | No Change |
| 9 | 🇮🇳 New Delhi | 57 | +6 |
| 10 | 🇺🇸 San Francisco | 52 | No Change |
| 11 | 🇹🇭 Bangkok | 49 | +2 |
| 12 | 🇹🇼 Taipei | 45 | +2 |
| 13 | 🇫🇷 Paris | 44 | -2 |
| 14 | 🇨🇳 Hangzhou | 43 | -5 |
| 15 | 🇸🇬 Singapore | 42 | New to Top 20 |
| 16 | 🇨🇳 Guangzhou | 39 | -4 |
| 17T | 🇮🇩 Jakarta | 37 | +1 |
| 17T | 🇧🇷 Sao Paulo | 37 | No Change |
| 19T | 🇺🇸 Los Angeles | 31 | No Change |
| 19T | 🇰🇷 Seoul | 31 | -3 |
In fact all Chinese cities on the top 20 list have lost billionaires between 2023–24. Consequently, they’ve all lost ranking spots as well, with Hangzhou seeing the biggest slide (-5) in the top 20.
Where China lost, all other Asian cities—except Seoul—in the top 20 have gained ranks. Indian cities lead the way, with New Delhi (+6) and Mumbai (+3) having climbed the most.
At a country level, China and the U.S combine to make up half of the cities in the top 20. They are also home to about half of the world’s 3,200 billionaire population.
In other news of note: Hurun officially counts Taylor Swift as a billionaire, estimating her net worth at $1.2 billion.

-

 Mining1 week ago
Gold vs. S&P 500: Which Has Grown More Over Five Years?
-

 Markets2 weeks ago
Ranked: The Most Valuable Housing Markets in America
-

 Money2 weeks ago
Which States Have the Highest Minimum Wage in America?
-

 AI2 weeks ago
Ranked: Semiconductor Companies by Industry Revenue Share
-

 Markets2 weeks ago
Ranked: The World’s Top Flight Routes, by Revenue
-

 Countries2 weeks ago
Population Projections: The World’s 6 Largest Countries in 2075
-

 Markets2 weeks ago
The Top 10 States by Real GDP Growth in 2023
-

 Demographics2 weeks ago
The Smallest Gender Wage Gaps in OECD Countries