Economy
The World’s Tech Giants, Compared to the Size of Economies
It’s no secret that tech giants have exploded in value over the last few years, but the scale can be hard to comprehend.
Through wide-scaling market penetration, smart diversification, and the transformation of products into services, Apple, Microsoft, Amazon, and Google have reached market capitalizations well above $1.5 trillion.
To help us better understand these staggering numbers, a recent study at Mackeeper took the market capitalization of multiple tech giants and compared them with the annual Gross Domestic Product (GDP) of countries.
Editor’s note: While these numbers are interesting to compare, it’s worth noting that they represent different things. Market cap is the total value of shares outstanding in a publicly-traded company and gives an indication of total valuation, and GDP measures the value of all goods and services produced by a country in an entire year.
Companies vs. Countries: Tech Giants
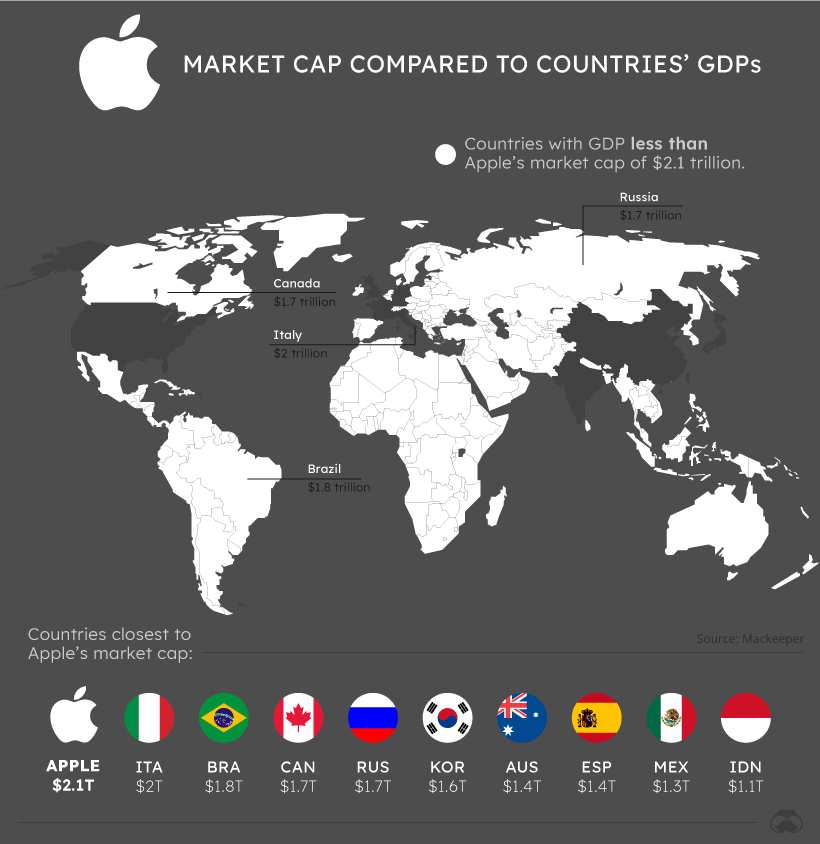


If Apple’s market capitalization was equal to a country’s annual GDP, it might just be in the G7.
At a market cap of more than $2.1 trillion, Apple’s market capitalization is larger than 96% of country GDPs, a list that includes Italy, Brazil, Canada, and Russia.
In fact, only seven countries in the world have a higher GDP than Apple’s market cap.
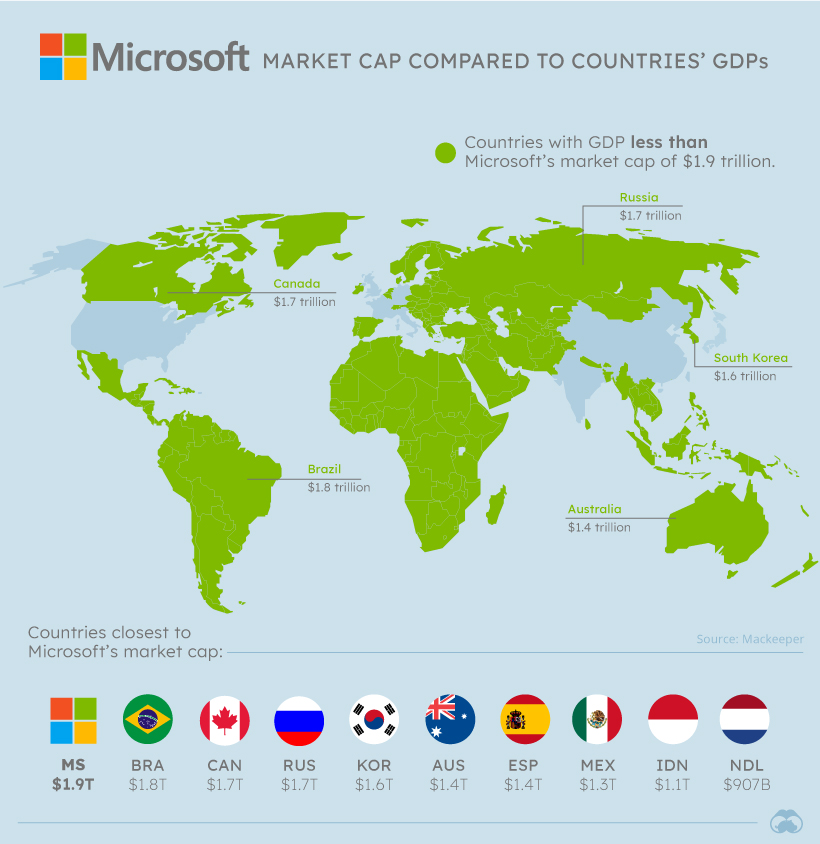
Further back is Microsoft, which would be the 10th richest country in the world if market cap was equivalent to GDP.
With a market cap of more than $1.9 trillion, Microsoft’s value is larger than the GDP of global powerhouses Brazil, Canada, Russia, and South Korea.
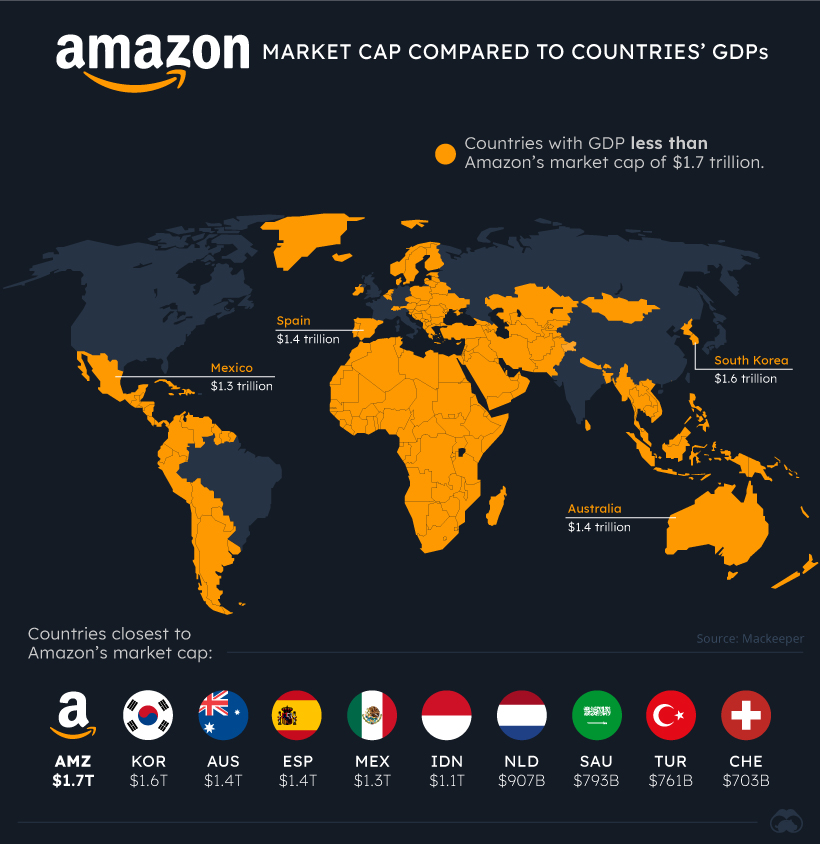
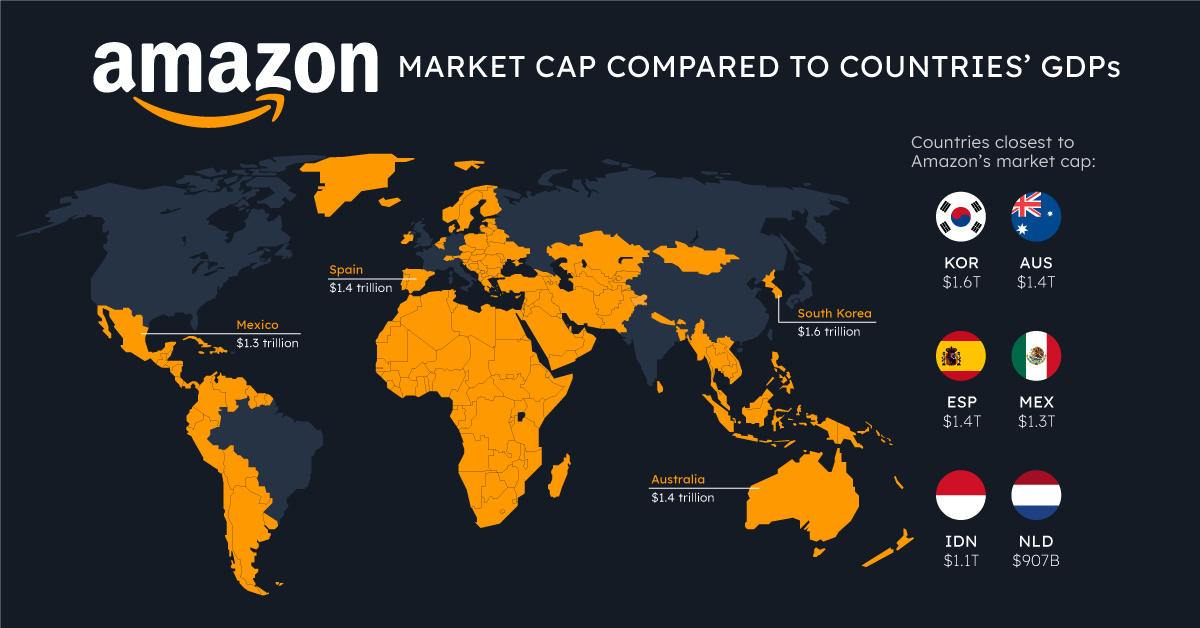
Though all of the tech giants fared well during the COVID-19 pandemic, perhaps none have stood to benefit as much as Amazon.
With online retail and web services both in high demand, Amazon’s market cap has grown to $1.7 trillion, larger than 92% of country GDPs.
Other Companies “Bigger” Than Countries
Tech giants aren’t the only companies that would give countries a run for their money.
| Country/Company | Nominal GDP (country) or Market Cap (company) |
|---|---|
| United States of America | $21,433 B |
| China | $14,343 B |
| Japan | $5,082 B |
| Germany | $3,861 B |
| India | $2,869 B |
| United Kingdom | $2,829 B |
| France | $2,716 B |
| Apple | $2,125 B |
| Italy | $2,004 B |
| Microsoft | $1,942 B |
| Saudi Aramco | $1,888 B |
| Brazil | $1,840 B |
| Canada | $1,736 B |
| Russia | $1700 B |
| Amazon | $1,688 B |
| Alphabet | $1,656 B |
| South Korea | $1,647 B |
| Australia | $1,397 B |
| Spain | $1,393 B |
| Mexico | $1,269 B |
| Indonesia | $1,119 B |
| $939 B | |
| Netherlands | $907 B |
| Saudi Arabia | $793 B |
| Turkey | $761 B |
| Tencent | $736 B |
| Switzerland | $703 B |
| Poland | $596 B |
Saudi Arabia’s state-owned corporation Saudi Aramco also makes the list, boasting a market cap more than double the GDP of its home country.
China’s tech giant Tencent also has a market cap that towers over many country GDPs, such as those of Switzerland or Poland.
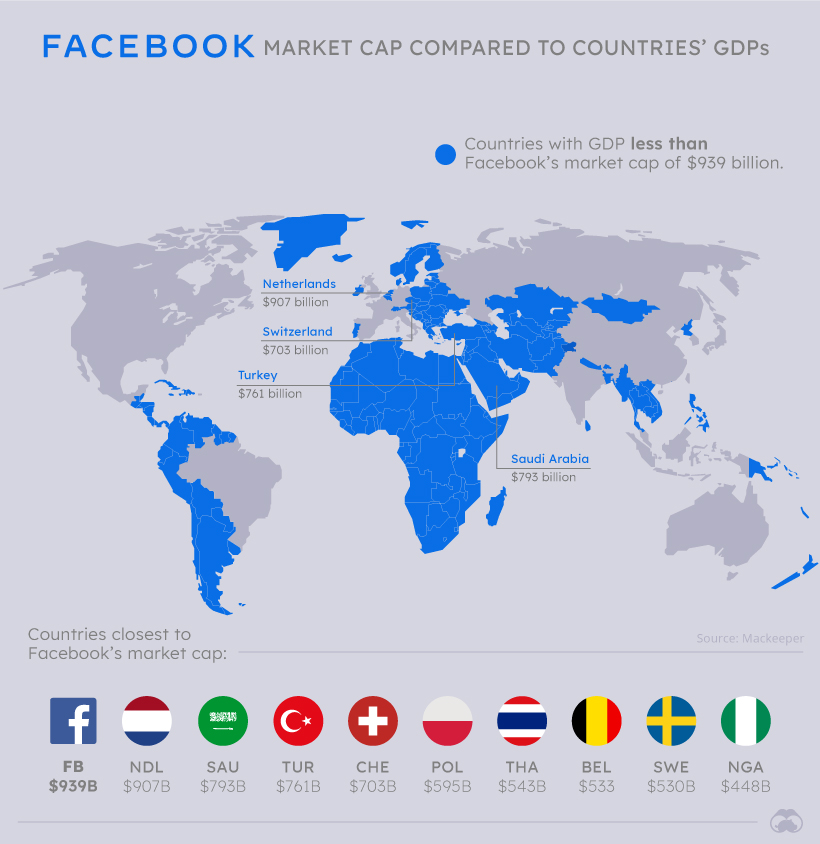
Until recently, Tencent was also ahead of fellow tech giant Facebook in market cap, but the social network has climbed ahead and almost reached $1 trillion in market capitalization.
Of course, the biggest caveat to consider with these comparisons is the difference between market cap and GDP numbers.
A company’s market cap is a proxy of its net worth in the eyes of public markets and changes constantly, while GDP measures the economic output of a country in a given year.
But companies directly and indirectly affect the economies of countries around the world. With international reach, wealth accumulation, and impact, it’s important to consider just how much wealth and power these companies have.


Misc
The Top 25 Nationalities of U.S. Immigrants
Mexico is the largest source of immigrants to the U.S., with almost 11 million immigrants.


The Top 25 Nationalities of U.S. Immigrants
This was originally posted on our Voronoi app. Download the app for free on iOS or Android and discover incredible data-driven charts from a variety of trusted sources.
The United States is home to more than 46 million immigrants, constituting approximately 14% of its total population.
This graphic displays the top 25 countries of origin for U.S. immigrants, based on 2022 estimates. The data is sourced from the Migration Policy Institute (MPI), which analyzed information from the U.S. Census Bureau’s 2022 American Community Survey.
In this context, “immigrants” refer to individuals residing in the United States who were not U.S. citizens at birth.
Mexico Emerges as a Leading Source of Immigration
Mexico stands out as the largest contributor to U.S. immigration due to its geographical proximity and historical ties.
Various economic factors, including wage disparities and employment opportunities, motivate many Mexicans to seek better prospects north of the border.
| Country | Region | # of Immigrants |
|---|---|---|
| 🇲🇽 Mexico | Latin America & Caribbean | 10,678,502 |
| 🇮🇳 India | Asia | 2,839,618 |
| 🇨🇳 China | Asia | 2,217,894 |
| 🇵🇭 Philippines | Asia | 1,982,333 |
| 🇸🇻 El Salvador | Latin America & Caribbean | 1,407,622 |
| 🇻🇳 Vietnam | Asia | 1,331,192 |
| 🇨🇺 Cuba | Latin America & Caribbean | 1,312,510 |
| 🇩🇴 Dominican Republic | Latin America & Caribbean | 1,279,900 |
| 🇬🇹 Guatemala | Latin America & Caribbean | 1,148,543 |
| 🇰🇷 Korea | Asia | 1,045,100 |
| 🇨🇴 Colombia | Latin America & Caribbean | 928,053 |
| 🇭🇳 Honduras | Latin America & Caribbean | 843,774 |
| 🇨🇦 Canada | Northern America | 821,322 |
| 🇯🇲 Jamaica | Latin America & Caribbean | 804,775 |
| 🇭🇹 Haiti | Latin America & Caribbean | 730,780 |
| 🇬🇧 United Kingdom | Europe | 676,652 |
| 🇻🇪 Venezuela | Latin America & Caribbean | 667,664 |
| 🇧🇷 Brazil | Latin America & Caribbean | 618,525 |
| 🇩🇪 Germany | Europe | 537,484 |
| 🇪🇨 Ecuador | Latin America & Caribbean | 518,287 |
| 🇵🇪 Peru | Latin America & Caribbean | 471,988 |
| 🇳🇬 Nigeria | Africa | 448,405 |
| 🇺🇦 Ukraine | Europe | 427,163 |
| 🇮🇷 Iran | Middle East | 407,283 |
| 🇵🇰 Pakistan | Asia | 399,086 |
| Rest of World | 11,637,634 | |
| Total | 46,182,089 |
Mexicans are followed in this ranking by Indians, Chinese, and Filipinos, though most immigrants on this list come from countries in the Latin American and Caribbean region.
On the other hand, only three European countries are among the top sources of U.S. immigrants: the UK, Germany, and Ukraine.
Immigration continues to be a significant factor contributing to the overall growth of the U.S. population. Overall population growth has decelerated over the past decade primarily due to declining birth rates.
Between 2021 and 2022, the increase in the immigrant population accounted for 65% of the total population growth in the U.S., representing 912,000 individuals out of nearly 1.4 million.
If you enjoyed this post, be sure to check out Visualized: Why Do People Immigrate to the U.S.? This visualization shows the different reasons cited by new arrivals to America in 2021.

-

 Personal Finance1 week ago
Visualizing the Tax Burden of Every U.S. State
-

 Misc6 days ago
Visualized: Aircraft Carriers by Country
-

 Culture7 days ago
How Popular Snack Brand Logos Have Changed
-

 Mining1 week ago
Visualizing Copper Production by Country in 2023
-

 Misc1 week ago
Charted: How Americans Feel About Federal Government Agencies
-

 Healthcare1 week ago
Which Countries Have the Highest Infant Mortality Rates?
-

 Demographics1 week ago
Mapped: U.S. Immigrants by Region
-

 Maps1 week ago
Mapped: Southeast Asia’s GDP Per Capita, by Country