Technology
Long Waves: The History of Innovation Cycles


Long Waves: How Innovation Cycles Influence Growth
Creative destruction plays a key role in entrepreneurship and economic development.
Coined by economist Joseph Schumpeter in 1942, the theory of “creative destruction” suggests that business cycles operate under long waves of innovation. Specifically, as markets are disrupted, key clusters of industries have outsized effects on the economy.
Take the railway industry, for example. At the turn of the 19th century, railways completely reshaped urban demographics and trade. Similarly, the internet disrupted entire industries—from media to retail.
The above infographic shows how innovation cycles have impacted economies since 1785, and what’s next for the future.
Innovation Cycles: The Six Waves
From the first wave of textiles and water power in the industrial revolution, to the internet in the 1990s, here are the six waves of innovation and their key breakthroughs.
| First Wave | Second Wave | Third Wave | Fourth Wave | Fifth Wave | Sixth Wave |
|---|---|---|---|---|---|
| Water Power Textiles Iron | Steam Rail Steel | Electricity Chemicals Internal-Combustion Engine | Petrochemicals Electronics Aviation | Digital Network Software New Media | Digitization (AI, IoT, AV, Robots & Drones) Clean Tech |
| 60 years | 55 years | 50 years | 40 years | 30 years | 25 years |
Source: Edelsen Institute, Detlef Reis
During the first wave of the Industrial Revolution, water power was instrumental in manufacturing paper, textiles, and iron goods. Unlike the mills of the past, full-sized dams fed turbines through complex belt systems. Advances in textiles brought the first factory, and cities expanded around them.
With the second wave, between about 1845 and 1900, came significant rail, steam, and steel advancements. The rail industry alone affected countless industries, from iron and oil to steel and copper. In turn, great railway monopolies were formed.
The emergence of electricity powering light and telephone communication through the third wave dominated the first half of the 1900s. Henry Ford introduced the Model T, and the assembly line transformed the auto industry. Automobiles became closely linked with the expansion of the American metropolis. Later, in the fourth wave, aviation revolutionized travel.
After the internet emerged by the early 1990s, barriers to information were upended. New media changed political discourse, news cycles, and communication in the fifth wave. The internet ushered in a new frontier of globalization, a borderless landscape of digital information flows.
Market Power
To the economist Schumpeter, technological innovations boosted economic growth and improved living standards.
However, these disruptors can also have a tendency to lead to monopolies. Especially during a cycle’s upswing, the strongest players realize wide margins, establish moats, and fend off rivals. Typically, these cycles begin when the innovations become of general use.
Of course, this can be seen today—never has the world been so closely connected. Information is more centralized than it has ever been, with Big Tech dominating global search traffic, social networks, and advertising.
Like the Big Tech behemoths of today, the rail industry had the power to control prices and push out competitors during the 19th century. At the peak, listed shares of rail companies on the New York Stock Exchange made up 60% of total stock market capitalization.
Waves of Change
As cycle longevity continues to shorten, the fifth wave may have a few years left under its belt.
The sixth wave, marked by artificial intelligence and digitization across information of things (IoT), robotics, and drones, will likely paint an entirely new picture. Namely, the automation of systems, predictive analytics, and data processing could make an impact. In turn, physical goods and services will likely be digitized. The time to complete tasks could shift from hours to even seconds.
At the same time, clean tech could come to the forefront. At the heart of each technological innovation is solving complex problems, and climate concerns are becoming increasingly pressing. Lower costs in solar PV and wind are also predicating efficiency advantages.


Technology
Charting the Next Generation of Internet
In this graphic, Visual Capitalist has partnered with MSCI to explore the potential of satellite internet as the next generation of internet innovation.
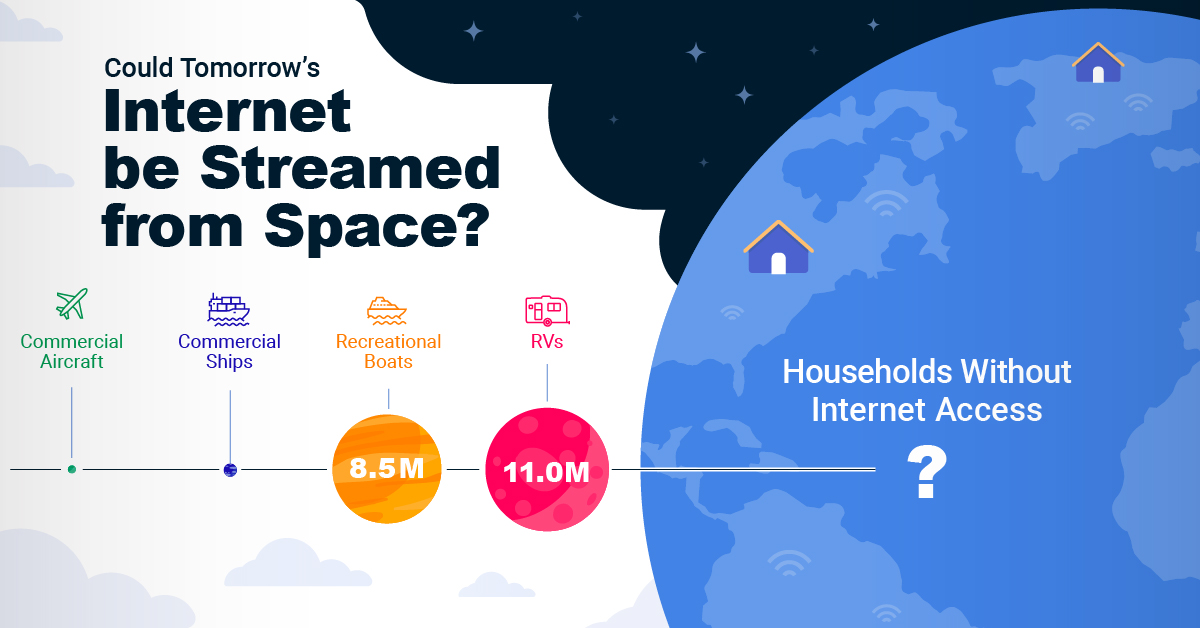

Could Tomorrow’s Internet be Streamed from Space?
In 2023, 2.6 billion people could not access the internet. Today, companies worldwide are looking to innovative technology to ensure more people are online at the speed of today’s technology.
Could satellite internet provide the solution?
In collaboration with MSCI, we embarked on a journey to explore whether tomorrow’s internet could be streamed from space.
Satellite Internet’s Potential Customer Base
Millions of people live in rural communities or mobile homes, and many spend much of their lives at sea or have no fixed abode. So, they cannot access the internet simply because the technology is unavailable.
Satellite internet gives these communities access to the internet without requiring a fixed location. Consequently, the volume of people who could get online using satellite internet is significant:
| Area | Potential Subscribers |
|---|---|
| Households Without Internet Access | 600,000,000 |
| RVs | 11,000,000 |
| Recreational Boats | 8,500,000 |
| Ships | 100,000 |
| Commercial Aircraft | 25,000 |
Advances in Satellite Technology
Satellite internet is not a new concept. However, it has only recently been that roadblocks around cost and long turnaround times have been overcome.
NASA’s space shuttle, until it was retired in 2011, was the only reusable means of transporting crew and cargo into orbit. It cost over $1.5 billion and took an average of 252 days to launch and refurbish.
In stark contrast, SpaceX’s Falcon 9 can now launch objects into orbit and maintain them at a fraction of the time and cost, less than 1% of the space shuttle’s cost.
| Average Rocket Turnaround Time | Average Launch/Refurbishment Cost | |
|---|---|---|
| Falcon 9* | 21 days | < $1,000,000 |
| Space Shuttle | 252 days | $1,500,000,000 (approximately) |
Satellites are now deployed 300 miles in low Earth orbit (LEO) rather than 22,000 miles above Earth in Geostationary Orbit (GEO), previously the typical satellite deployment altitude.
What this means for the consumer is that satellite internet streamed from LEO has a latency of 40 ms, which is an optimal internet connection. Especially when compared to the 700 ms stream latency experienced with satellite internet streamed from GEO.
What Would it Take to Build a Satellite Internet?
SpaceX, the private company that operates Starlink, currently has 4,500 satellites. However, the company believes it will require 10 times this number to provide comprehensive satellite internet coverage.
Charting the number of active satellites reveals that, despite the increasing number of active satellites, many more must be launched to create a comprehensive satellite internet.
| Year | Number of Active Satellites |
|---|---|
| 2022 | 6,905 |
| 2021 | 4,800 |
| 2020 | 3,256 |
| 2019 | 2,272 |
| 2018 | 2,027 |
| 2017 | 1,778 |
| 2016 | 1,462 |
| 2015 | 1,364 |
| 2014 | 1,262 |
| 2013 | 1,187 |
Next-Generation Internet Innovation
Innovation is at the heart of the internet’s next generation, and the MSCI Next Generation Innovation Index exposes investors to companies that can take advantage of potentially disruptive technologies like satellite internet.
You can gain exposure to companies advancing access to the internet with four indexes:
- MSCI ACWI IMI Next Generation Internet Innovation Index
- MSCI World IMI Next Generation Internet Innovation 30 Index
- MSCI China All Shares IMI Next Generation Internet Innovation Index
- MSCI China A Onshore IMI Next Generation Internet Innovation Index
MSCI thematic indexes are objective, rules-based, and regularly updated to focus on specific emerging trends that could evolve.
Click here to explore the MSCI thematic indexes

-

 Technology6 days ago
Countries With the Highest Rates of Crypto Ownership
While the U.S. is a major market for cryptocurrencies, two countries surpass it in terms of their rates of crypto ownership.
-

 Technology1 week ago
Mapped: The Number of AI Startups By Country
Over the past decade, thousands of AI startups have been funded worldwide. See which countries are leading the charge in this map graphic.
-

 Technology3 weeks ago
All of the Grants Given by the U.S. CHIPS Act
Intel, TSMC, and more have received billions in subsidies from the U.S. CHIPS Act in 2024.
-

 Technology3 weeks ago
Visualizing AI Patents by Country
See which countries have been granted the most AI patents each year, from 2012 to 2022.
-

 Technology3 weeks ago
How Tech Logos Have Evolved Over Time
From complete overhauls to more subtle tweaks, these tech logos have had quite a journey. Featuring: Google, Apple, and more.
-

 AI1 month ago
Ranked: Semiconductor Companies by Industry Revenue Share
Nvidia is coming for Intel’s crown. Samsung is losing ground. AI is transforming the space. We break down revenue for semiconductor companies.


-

 Mining6 days ago
Where the World’s Aluminum is Smelted, by Country
-

 Markets2 weeks ago
Visualized: Interest Rate Forecasts for Advanced Economies
-

 Economy2 weeks ago
The Most Valuable Companies in Major EU Economies
-

 Markets2 weeks ago
The World’s Fastest Growing Emerging Markets (2024-2029 Forecast)
-

 Markets2 weeks ago
Visualizing Global Inflation Forecasts (2024-2026)
-

 Misc1 week ago
Charted: What Southeast Asia Thinks About China & the U.S.
-

 Misc1 week ago
The Evolution of U.S. Beer Logos
-

 Healthcare1 week ago
What Causes Preventable Child Deaths?