Datastream
The Biggest Political Spenders and Donators in America, By Generation


The Briefing
- When it comes to the biggest political spenders in the U.S., Baby Boomers rank #1
- The Silent Generation is a close 2nd, followed by Gen X and Millennials respectively
- Overall political spending in the U.S. has reached all-time highs, but small donor spending (people who give $200 or less) still accounts for a fraction of overall donations
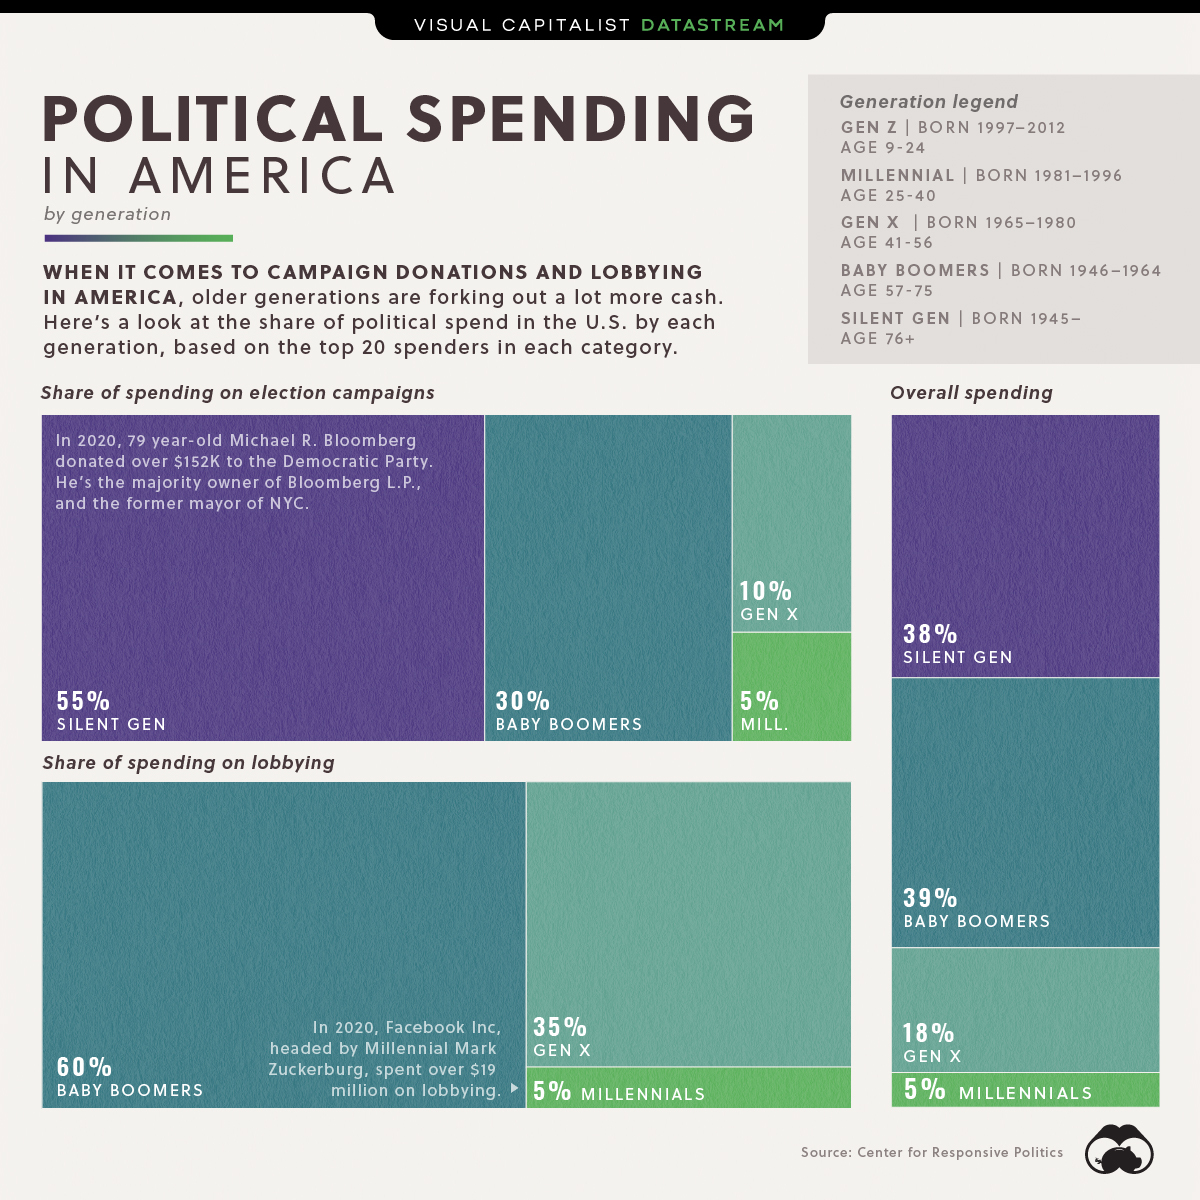
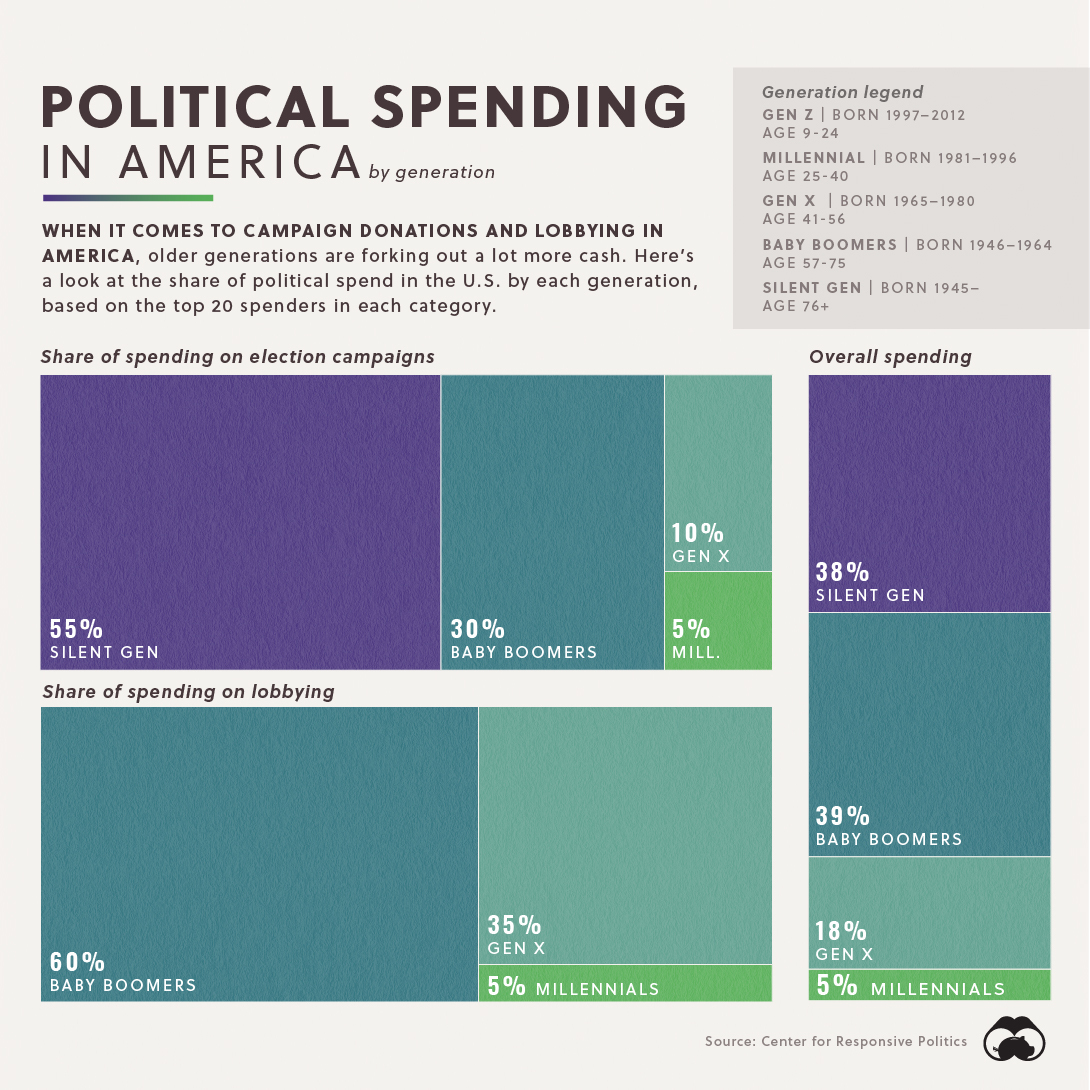
Political Spending in America, By Generation
In politics, the candidate who spends the most money usually wins. Because of this, donations are an important part of political campaigns, and the people behind those donations wield an intangible level of power and influence.
As our team put together the inaugural Generational Power Index (GPI), which looks at power dynamics across generations in the U.S., we started wondering which generation spent the most on political campaigns and lobbying.
Here’s what we found out.
Old Money
Of top spenders in the U.S., the Silent Generation (age 76+) and Baby Boomers (age 57-75) both sit at the top of the ranking.
In 2020, 55% of the biggest campaign donations in the U.S. came from the Silent Generation, and meanwhile, more than 60% of the biggest lobbying expenditures came from organizations run by Baby Boomers.
| Generation | Share of U.S. Spend on Electoral Campaigns | Share of U.S. Spend on Lobbying | Overall U.S. Spend |
|---|---|---|---|
| Gen Z | 0% | 0% | 0% |
| Millennials | 5% | 5% | 5% |
| Gen X | 10% | 35% | 18% |
| Baby Boomers | 30% | 60% | 39% |
| Silent Generation | 55% | 0% | 38% |
| Total | 100% | 100% | 100% |
*Note: Percentages are based on the top 20 spenders in each category, not overall spending.
Outliers
Of course, there were a few exceptions.
Facebook, run by Millennial Mark Zuckerburg, spent over $19 million on lobbying in 2020. The social media giant spent more than any other Big Tech monolith, with lobbying efforts focused on competition and consumer privacy issues.
When it comes to electoral spending, Millennial Dustin Moskovitz is the youngest person on the list, contributing over $50 million to the Democrats in 2020. Interestingly, he co-founded Facebook back in 2004, but he left in 2008 to start the project management platform, Asana.
Where does this data come from?
Source: Visual Capitalist’s 2021 Generational Power Index (GPI)
Notes: Check out the full report for more information around methodology
Datastream
Can You Calculate Your Daily Carbon Footprint?
Discover how the average person’s carbon footprint impacts the environment and learn how carbon credits can offset your carbon footprint.


The Briefing
- A person’s carbon footprint is substantial, with activities such as food consumption creating as much as 4,500 g of CO₂ emissions daily.
- By purchasing carbon credits from Carbon Streaming Corporation, you can offset your own emissions and fund positive climate action.
Your Everyday Carbon Footprint
While many large businesses and countries have committed to net-zero goals, it is essential to acknowledge that your everyday activities also contribute to global emissions.
In this graphic, sponsored by Carbon Streaming Corporation, we will explore how the choices we make and the products we use have a profound impact on our carbon footprint.
Carbon Emissions by Activity
Here are some of the daily activities and products of the average person and their carbon footprint, according to Clever Carbon.
| Household Activities & Products | CO2 Emissions (g) |
|---|---|
| 💡 Standard Light Bulb (100 watts, four hours) | 172 g |
| 📱 Mobile Phone Use (195 minutes per day)* | 189 g |
| 👕 Washing Machine (0.63 kWh) | 275 g |
| 🔥 Electric Oven (1.56 kWh) | 675 g |
| ♨️ Tumble Dryer (2.5 kWh) | 1,000 g |
| 🧻 Toilet Roll (2 ply) | 1,300 g |
| 🚿 Hot Shower (10 mins) | 2,000 g |
| 🚙 Daily Commute (one hour, by car) | 3,360 g |
| 🍽️ Average Daily Food Consumption (three meals of 600 calories) | 4,500 g |
| *Phone use based on yearly use of 69kg per the source, Reboxed | |
Your choice of transportation plays a crucial role in determining your carbon footprint. For instance, a 15 km daily commute to work on public transport generates an average of 1,464 g of CO₂ emissions. Compared to 3,360 g—twice the volume for a journey the same length by car.
By opting for more sustainable modes of transport, such as cycling, walking, or public transportation, you can significantly reduce your carbon footprint.
Addressing Your Carbon Footprint
One way to compensate for your emissions is by purchasing high-quality carbon credits.
Carbon credits are used to help fund projects that avoid, reduce or remove CO₂ emissions. This includes nature-based solutions such as reforestation and improved forest management, or technology-based solutions such as the production of biochar and carbon capture and storage (CCS).
While carbon credits offer a potential solution for individuals to help reduce global emissions, public awareness remains a significant challenge. A BCG-Patch survey revealed that only 34% of U.S. consumers are familiar with carbon credits, and only 3% have purchased them in the past.
About Carbon Streaming
By financing the creation or expansion of carbon projects, Carbon Streaming Corporation secures the rights to future carbon credits generated by these sustainable projects. You can then purchase these carbon credits to help fund climate solutions around the world and compensate for your own emissions.
Ready to get involved?
>> Learn more about purchasing carbon credits at Carbon Streaming

-

 Mining1 week ago
Gold vs. S&P 500: Which Has Grown More Over Five Years?
-

 Markets2 weeks ago
Ranked: The Most Valuable Housing Markets in America
-

 Money2 weeks ago
Which States Have the Highest Minimum Wage in America?
-

 AI2 weeks ago
Ranked: Semiconductor Companies by Industry Revenue Share
-

 Markets2 weeks ago
Ranked: The World’s Top Flight Routes, by Revenue
-

 Countries2 weeks ago
Population Projections: The World’s 6 Largest Countries in 2075
-

 Markets2 weeks ago
The Top 10 States by Real GDP Growth in 2023
-

 Demographics2 weeks ago
The Smallest Gender Wage Gaps in OECD Countries