Mapped: Europe’s GDP Per Capita, by Country
The Growth of a $1,000 Equity Investment, by Stock Market
Mapped: The Most Valuable Company in Each Southeast Asian Country
Visualizing Global Inflation Forecasts (2024-2026)
The World’s Fastest Growing Emerging Markets (2024-2029 Forecast)
Countries With the Highest Rates of Crypto Ownership
Mapped: The Number of AI Startups By Country
All of the Grants Given by the U.S. CHIPS Act
Visualizing AI Patents by Country
How Tech Logos Have Evolved Over Time
Visualizing the Tax Burden of Every U.S. State
Charted: What Frustrates Americans About the Tax System
Ranked: The Top 20 Countries in Debt to China
Charted: Which Country Has the Most Billionaires in 2024?
Charted: Which City Has the Most Billionaires in 2024?
Mapped: Countries Where Recreational Cannabis is Legal
Which Countries Have the Highest Infant Mortality Rates?
Life Expectancy by Region (1950-2050F)
What Causes Preventable Child Deaths?
The Cost of an EpiPen in Major Markets
Who’s Building the Most Solar Energy?
Mapped: The Age of Energy Projects in Interconnection Queues, by State
Ranked: The Top 10 EV Battery Manufacturers in 2023
The World’s Biggest Nuclear Energy Producers
The World’s Biggest Oil Producers in 2023
Mapped: U.S. States By Number of Cities Over 250,000 Residents
Mapped: U.S. Immigrants by Region
Mapped: Southeast Asia’s GDP Per Capita, by Country
The Largest Earthquakes in the New York Area (1970-2024)
The Biggest Salt Producing Countries in 2023
Visualizing Copper Production by Country in 2023
Where the World’s Aluminum is Smelted, by Country
Visualizing Global Gold Production in 2023
How People Get Around in America, Europe, and Asia
The Carbon Footprint of Major Travel Methods
Ranking the Top 15 Countries by Carbon Tax Revenue
Ranked: The Countries With the Most Air Pollution in 2023
Top Countries By Forest Growth Since 2001
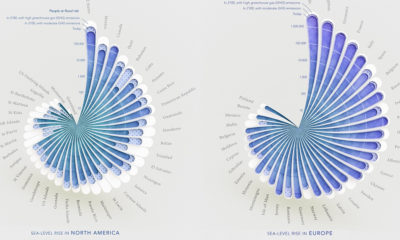
Here's a look at how people around the world could be impacted by coastal flooding by 2100, based on rising sea level projections.
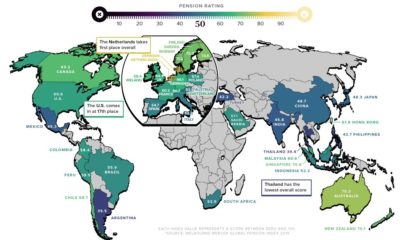
As the global population ages, pension reform is more important than ever. Here’s a breakdown of how key countries rank in terms of pension plans.
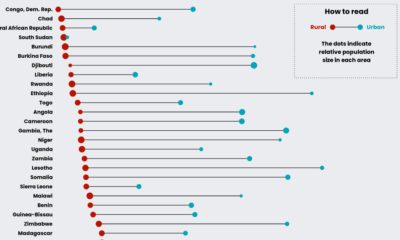
This graphic compares water accessibility in countries across Sub-Saharan Africa, showing the gap between its rural and urban populations.
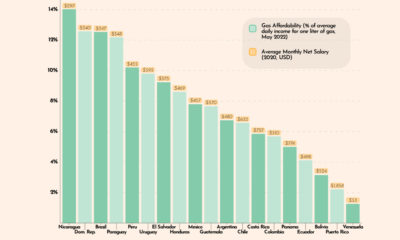
This graphic looks at gas affordability in Latin America, showing how much a liter of gas costs in 19 countries, relative to average incomes.
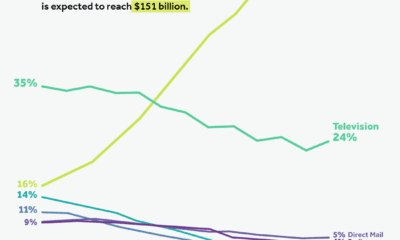
Internet advertising has shown steady growth in the last decade. By 2024, it’s projected to capture 60% of total ad spend in the United States.
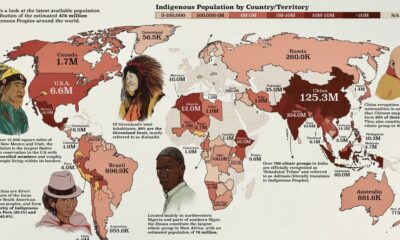
This map by shows the population distribution of the roughly 476 million Indigenous groups around the world.
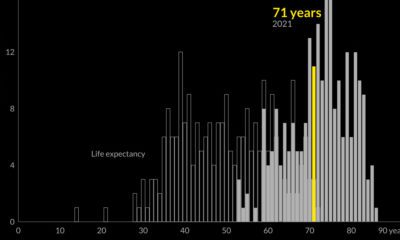
Global life expectancy has been increasing worldwide over the last 70 years. But how does the picture break down by region and by sex?
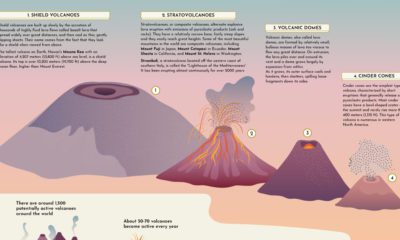
This graphic provides a brief introduction to volcanoes, explaining their different types of shapes and sizes, and how they erupt.
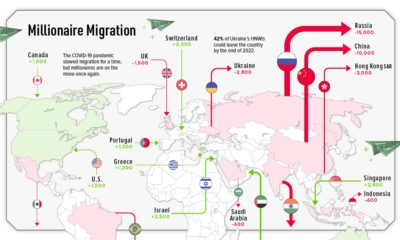
This graphic maps out the migration of millionaires across the globe, showing the top 10 countries the ultra-rich are moving to and from.
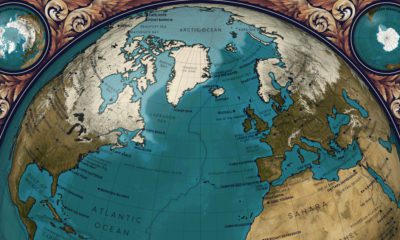
This map visualizes Earth’s seasons, showing how our planet’s Arctic sea ice and vegetation changes throughout the year.


 Creator Program