Oil and Gas
How Affordable is Gas in Latin America?
Article/Editing:
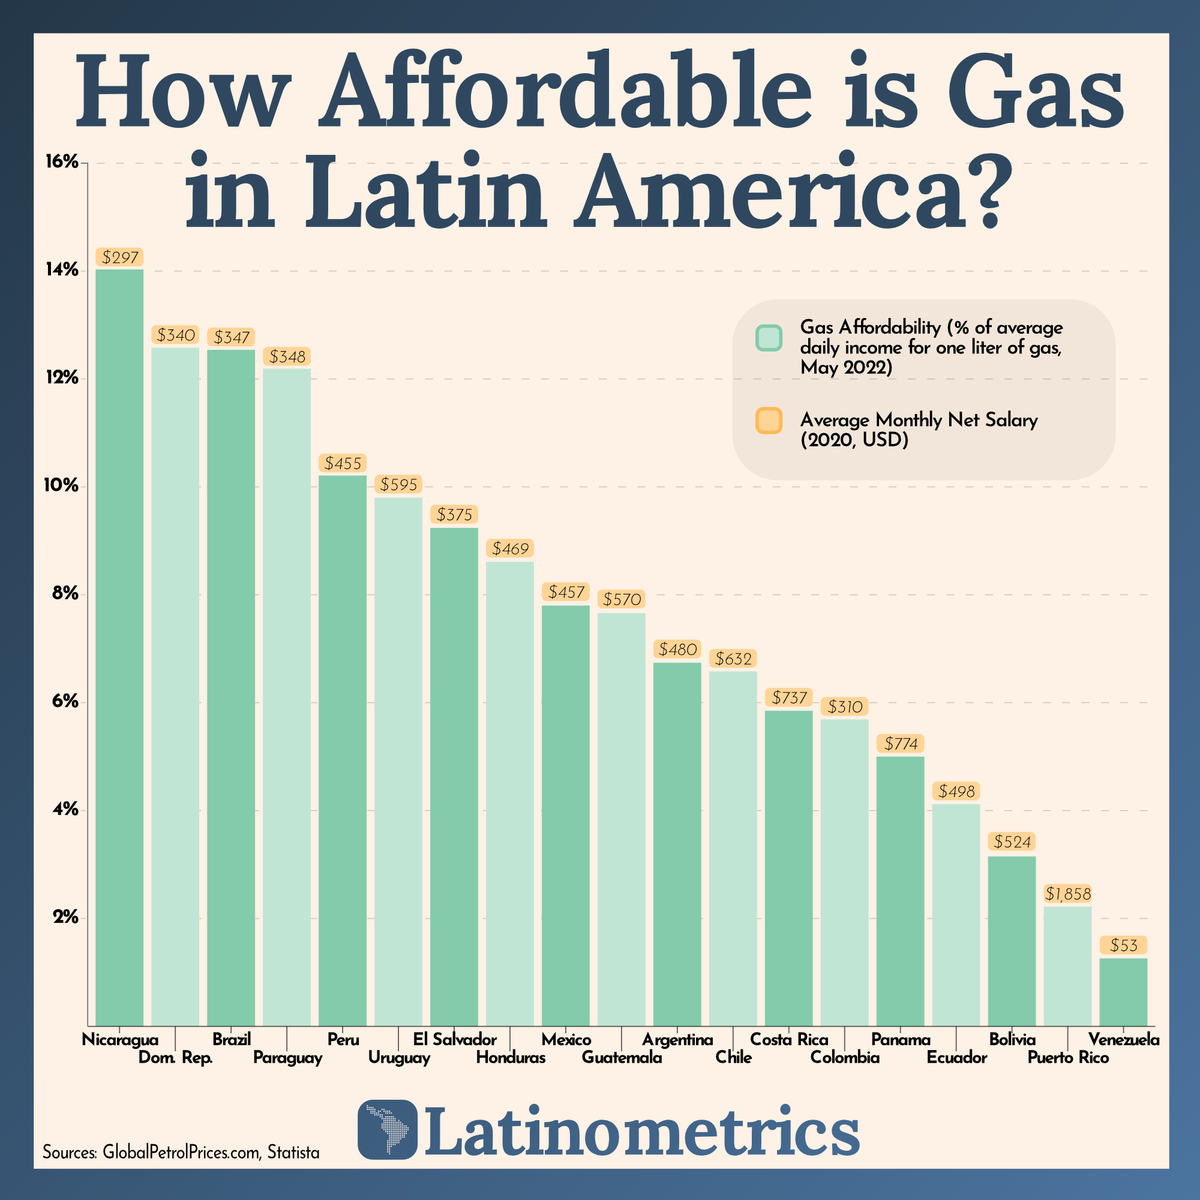
How Affordable is Gas in Latin America?
As gas prices have risen around the world, not each region and country is impacted equally.
Globally, the average price for a liter of gas was $1.44 USD on June 13, 2022.
But the actual price at the pump, and how affordable that price is for residents, varies greatly from country to country. This is especially true in Latin America, a region widely regarded as one of the world’s most unequal regions in terms of its income and resource distribution.
Using monthly data from GlobalPetrolPrices.com as of May 2022, this graphic by Latinometrics compares gas affordability in different countries across Latin America.
Gas Affordability in 19 Different Latin American Countries
To measure gas affordability, Latinometrics took the price of a liter of gas in 19 different Latin American countries and territories, and divided those figures by each country’s average daily income, using salary data from Statista.
Out of the 19 regions included in the dataset, Venezuela has the most affordable gas on the list. In Venezuela, a liter of gas is equivalent to roughly 1.3% of the country’s average daily income.
| Country | Gas price as of May 2022 (USD) | % of average daily income |
|---|---|---|
| 🇳🇮 Nicaragua | $1.37 | 14.0% |
| 🇩🇴 Dominican Republic | $1.41 | 12.6% |
| 🇧🇷 Brazil | $1.43 | 12.5% |
| 🇵🇾 Paraguay | $1.39 | 12.2% |
| 🇵🇪 Peru | $1.53 | 10.2% |
| 🇺🇾 Uruguay | $1.92 | 9.8% |
| 🇸🇻 El Salvador | $1.14 | 9.2% |
| 🇭🇳 Honduras | $1.33 | 8.6% |
| 🇲🇽 Mexico | $1.17 | 7.8% |
| 🇬🇹 Guatemala | $1.44 | 7.7% |
| 🇦🇷 Argentina | $1.06 | 6.7% |
| 🇨🇱 Chile | $1.37 | 6.6% |
| 🇨🇷 Costa Rica | $1.42 | 5.9% |
| 🇨🇴 Colombia | $0.58 | 5.7% |
| 🇵🇦 Panama | $1.27 | 5.0% |
| 🇪🇨 Ecuador | $0.67 | 4.1% |
| 🇧🇴 Bolivia | $0.54 | 3.2% |
| 🇵🇷 Puerto Rico | $1.35 | 2.2% |
| 🇻🇪 Venezuela | $0.02 | 1.3% |
This isn’t too surprising, as Venezuela is home to the largest share of proven oil reserves in the world. However, it’s worth noting that international sanctions against Venezuelan oil, largely because of political corruption, have hampered the once prosperous sector in the country.
On the other end of the spectrum, Nicaragua has the least affordable gas on the list, with one liter of gas costing 14% of the average daily income in the country.
Historically, the Nicaraguan government has not regulated gas prices in the country, but in light of the current global energy crisis triggered in large part by the Russia-Ukraine conflict, the government has stepped in to help control the situation.
As the Russia-Ukraine conflict continues with no end in sight, it’ll be interesting to see where prices are at in the next few months.

This article was published as a part of Visual Capitalist's Creator Program, which features data-driven visuals from some of our favorite Creators around the world.


Energy
Mapped: The Top Middle East Exports by Country
It’s more than just oil. This map of Middle East exports shows the top global product of each country by value.
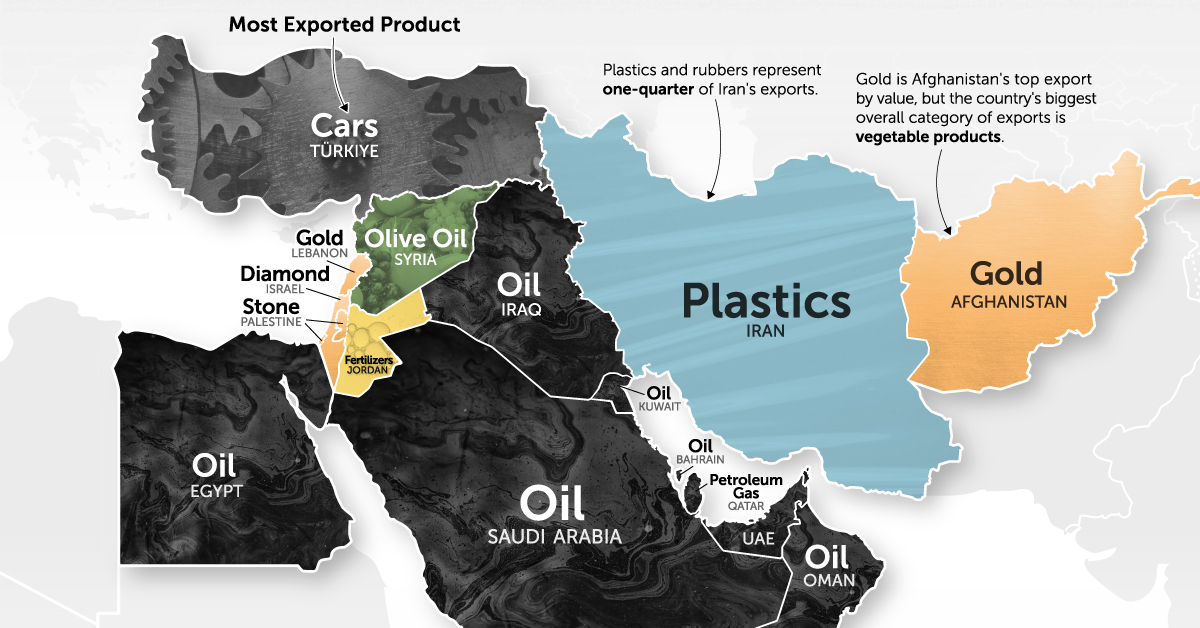
Mapped: The Top Middle East Exports by Country
The Middle East is widely recognized for its significant role in the global energy market. However, countries in the region also foster other substantial industries, including metals, chemicals, and agriculture.
The graphic above uses 2021 exports data from The Observatory of Economic Complexity to help explain the economy of the Middle East.
Top Exports by Middle-Eastern Countries in 2021
In 2021, the Middle East’s exports reached a total value of $1.27 trillion. While the region lags behind Asia, Europe, and North America in global exports, it outpaces Africa and South America.
Despite many countries undertaking efforts to diversify their economies and reduce their oil dependence, most of the exports still come from fossil fuels.
| Country | Top Export (2021) | Top Export Value | Total Exports Value |
|---|---|---|---|
| 🇦🇪 UAE | Crude petroleum | $58.5B | $296.0B |
| 🇸🇦 Saudi Arabia | Crude petroleum | $138.0B | $256.0B |
| 🇹🇷 Turkey | Cars | $10.0B | $234.0B |
| 🇶🇦 Qatar | Petroleum gas | $57.2B | $94.7B |
| 🇮🇶 Iraq | Crude petroleum | $72.0B | $81.1B |
| 🇮🇱 Israel | Diamonds | $9.1B | $64.1B |
| 🇰🇼 Kuwait | Crude petroleum | $40.1B | $58.2B |
| 🇴🇲 Oman | Crude petroleum | $24.2B | $56.9B |
| 🇪🇬 Egypt | Refined petroleum | $4.8B | $44.5B |
| 🇧🇭 Bahrain | Refined petroleum | $4.3B | $15.0B |
| 🇮🇷 Iran | Ethylene polymers | $3.2B | $14.0B |
| 🇯🇴 Jordan | Potassic fertilizers | $1.2B | $12.0B |
| 🇱🇧 Lebanon | Gold | $0.4B | $4.8B |
| 🇾🇪 Yemen | Crude petroleum | $1.1B | $2.0B |
| 🇦🇫 Afghanistan | Grapes | $0.4B | $1.9B |
| 🇵🇸 Palestine | Building stone | $0.2B | $1.5B |
| 🇸🇾 Syria | Pure olive oil | $0.1B | $1.0B |
The Middle East accounts for one-third of global oil production, producing over 30 million barrels per day. Five of the world’s top 10 oil producers are located in the region.
But some countries like Türkiye show off more diverse economies. The country’s exports range from minerals to machinery and textiles, with cars as its top export. The country is actually one of the world’s top automotive exporters.
Israel is another of the Middle East’s most diverse economies. The country’s major exports encompass electronics, software, and refined petroleum, but cut diamonds rank as the country’s largest single export by value.
Iran has tapped into its ample reserves of oil and natural gas in a different way, becoming a significant producer of plastics. Presently, plastics and rubbers constitute one-quarter of Iran’s exports.
How the Middle East Impacts the Global Economy
Given that the oil sector is one of the most significant in the global economy in terms of both volume and transaction value, many Middle Eastern countries are substantial players in international politics.
Nations such as Saudi Arabia and the UAE have direct impact on the oil market and play a pivotal role in determining the price of the commodity.
Due to the region’s massive exports (and imports of goods), and the importance of oil and gas in goods manufacturing worldwide, regional conflicts by Middle Eastern countries also impact global markets directly.

-

 Money2 weeks ago
Which States Have the Highest Minimum Wage in America?
-

 Misc1 week ago
Airline Incidents: How Do Boeing and Airbus Compare?
-

 Environment1 week ago
Top Countries By Forest Growth Since 2001
-

 United States2 weeks ago
Where U.S. Inflation Hit the Hardest in March 2024
-

 Demographics2 weeks ago
The Smallest Gender Wage Gaps in OECD Countries
-

 Markets2 weeks ago
The Top 10 States by Real GDP Growth in 2023
-

 Countries2 weeks ago
Population Projections: The World’s 6 Largest Countries in 2075
-

 Travel2 weeks ago
Ranked: The World’s Top Flight Routes, by Revenue