Mapped: Europe’s GDP Per Capita, by Country
The Growth of a $1,000 Equity Investment, by Stock Market
Mapped: The Most Valuable Company in Each Southeast Asian Country
Visualizing Global Inflation Forecasts (2024-2026)
The World’s Fastest Growing Emerging Markets (2024-2029 Forecast)
Countries With the Highest Rates of Crypto Ownership
Mapped: The Number of AI Startups By Country
All of the Grants Given by the U.S. CHIPS Act
Visualizing AI Patents by Country
How Tech Logos Have Evolved Over Time
Visualizing the Tax Burden of Every U.S. State
Charted: What Frustrates Americans About the Tax System
Ranked: The Top 20 Countries in Debt to China
Charted: Which Country Has the Most Billionaires in 2024?
Charted: Which City Has the Most Billionaires in 2024?
Mapped: Countries Where Recreational Cannabis is Legal
Which Countries Have the Highest Infant Mortality Rates?
Life Expectancy by Region (1950-2050F)
What Causes Preventable Child Deaths?
The Cost of an EpiPen in Major Markets
Who’s Building the Most Solar Energy?
Mapped: The Age of Energy Projects in Interconnection Queues, by State
Ranked: The Top 10 EV Battery Manufacturers in 2023
The World’s Biggest Nuclear Energy Producers
The World’s Biggest Oil Producers in 2023
Mapped: U.S. Immigrants by Region
Mapped: Southeast Asia’s GDP Per Capita, by Country
The Largest Earthquakes in the New York Area (1970-2024)
Mapped: Average Wages Across Europe
Visualizing Copper Production by Country in 2023
Where the World’s Aluminum is Smelted, by Country
Visualizing Global Gold Production in 2023
Gold vs. S&P 500: Which Has Grown More Over Five Years?
How People Get Around in America, Europe, and Asia
The Carbon Footprint of Major Travel Methods
Ranking the Top 15 Countries by Carbon Tax Revenue
Ranked: The Countries With the Most Air Pollution in 2023
Top Countries By Forest Growth Since 2001
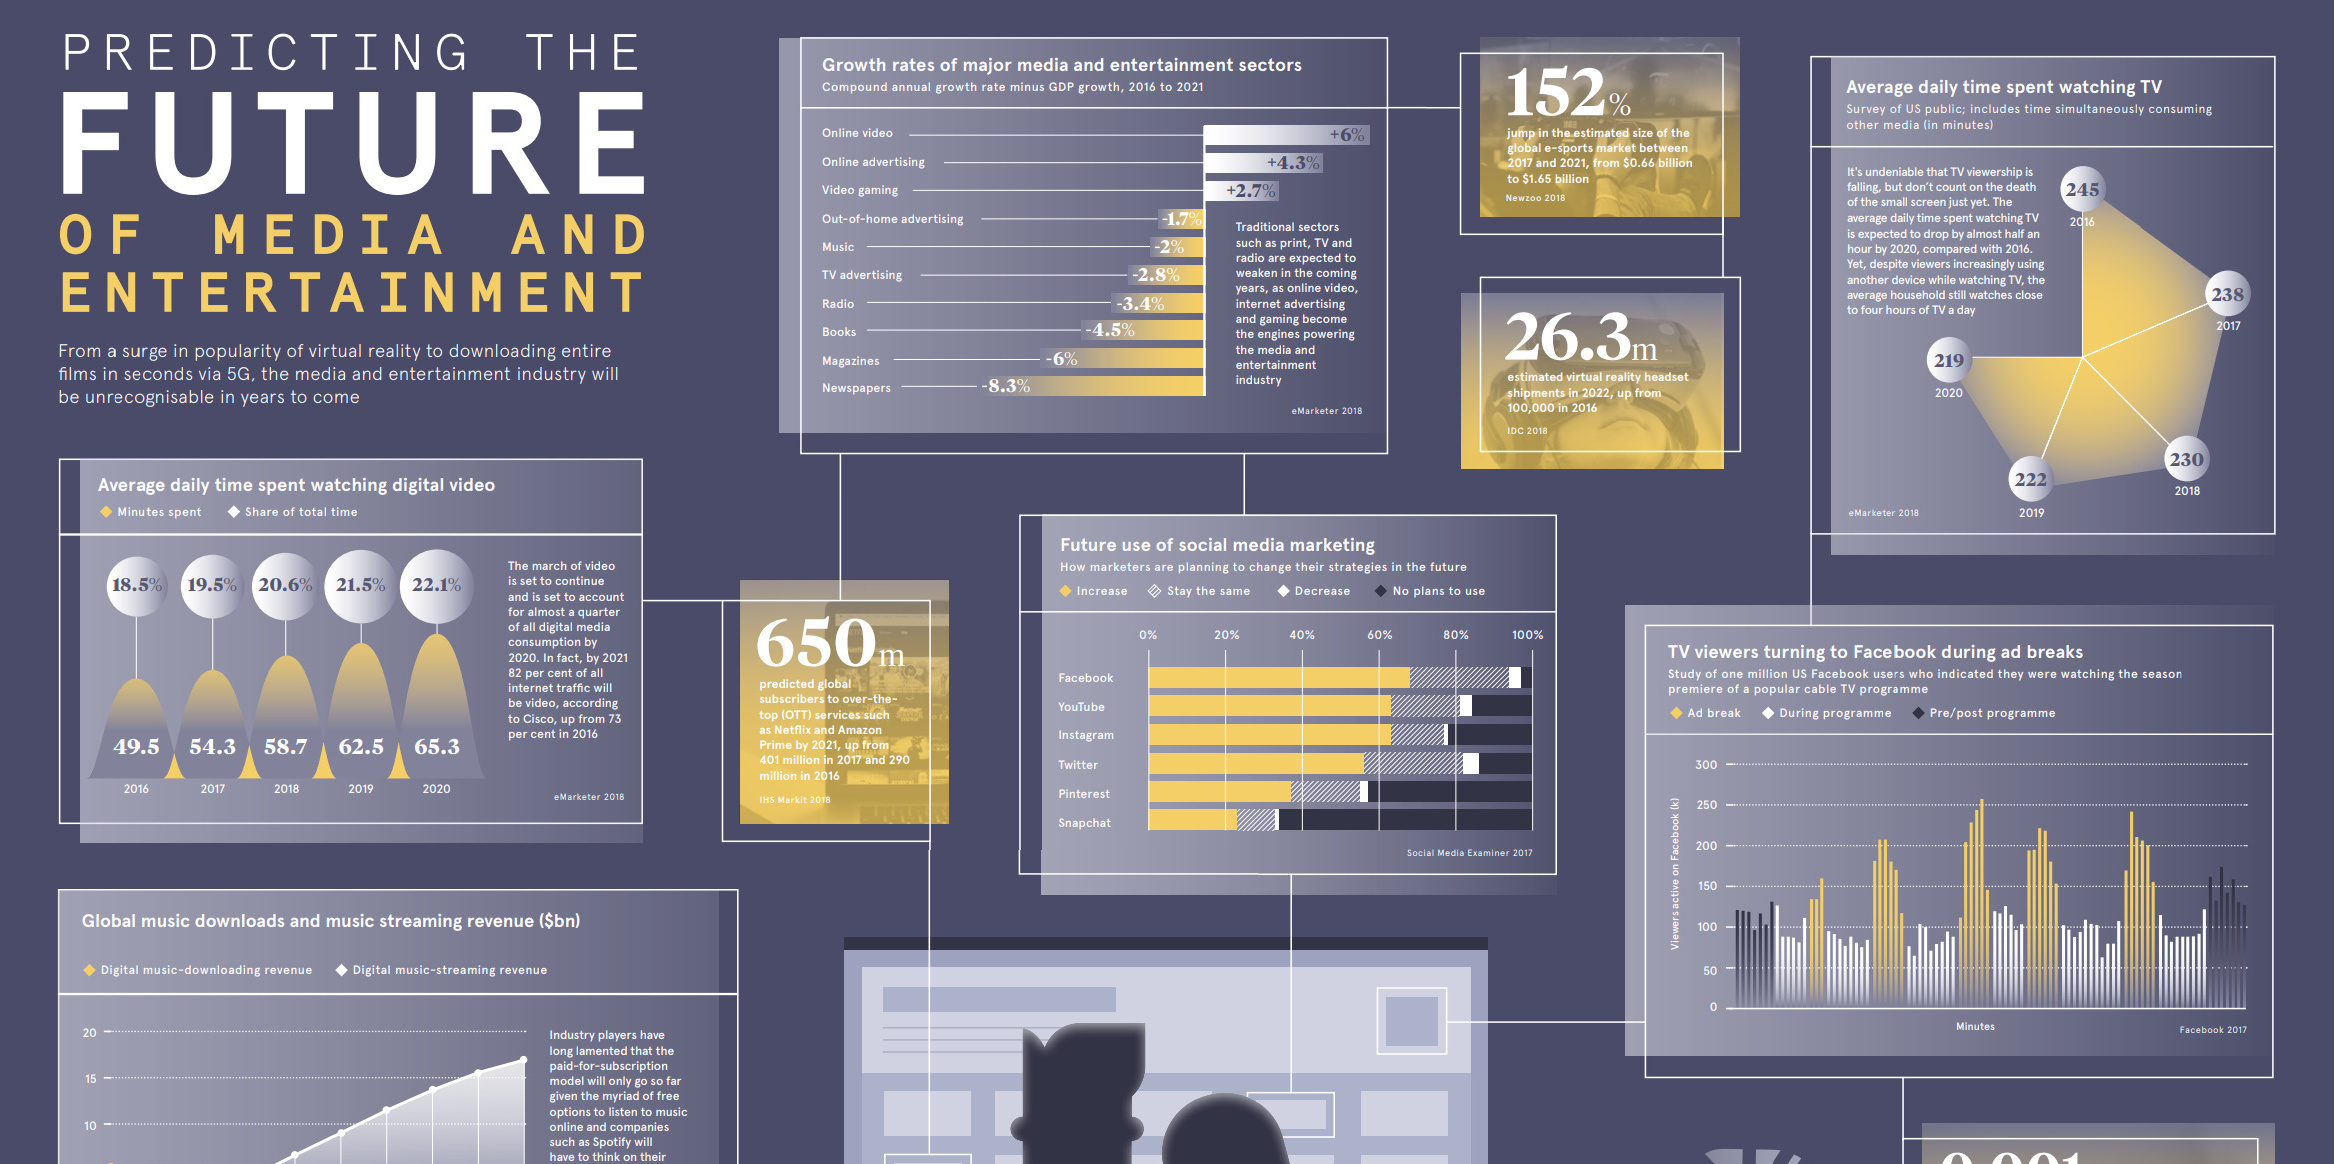
What technologies and trends are driving the future of media and entertainment? See the data in this large and information-packed infographic.
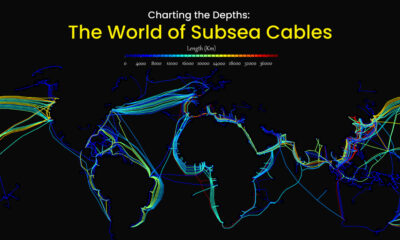
Hidden beneath the waves and sprawling along the ocean floor, subsea cables account for approximately 95% of international data transmitted.
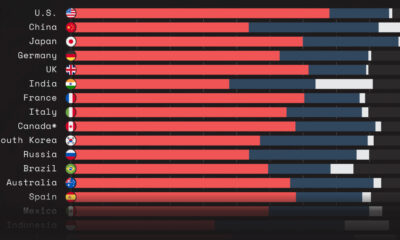
This graphic shows GDP by country, broken down into three main sectors: services, industry, and agriculture.
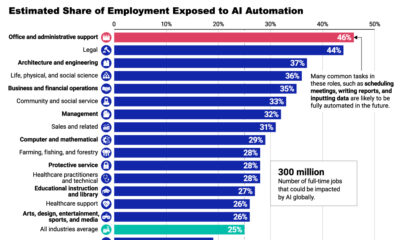
AI automation is expected to impact some industries more than others. See the latest projections in this infographic.
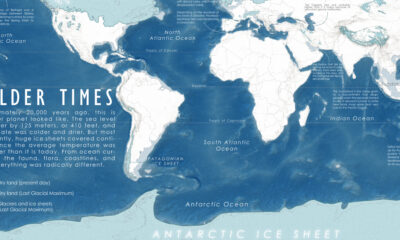
A map of the Earth 20,000 years ago, at the peak of the last ice age, when colder temperatures transformed the planet we know so well.
Modular housing can be completed 40% faster and costs 10-25% less than traditional construction methods. Is the future of housing modular?
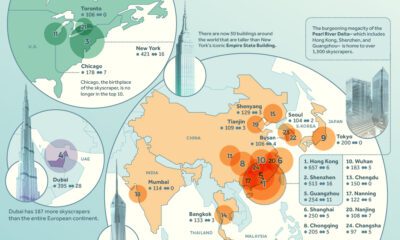
We rank the world's leading cities with the most skyscrapers, highlighting China's remarkable dominance in building vertically.
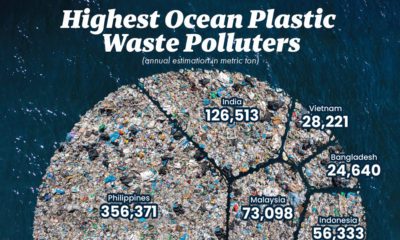
This graphic visualizes the top 10 countries emitting plastic pollutants into our oceans.
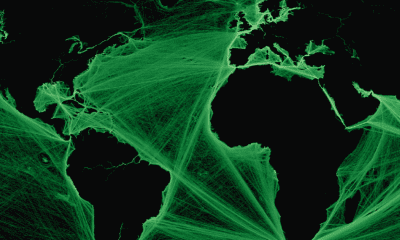
Where are the world’s major shipping lanes? These maps show global maritime traffic density, highlighting some of the busiest areas across the globe.
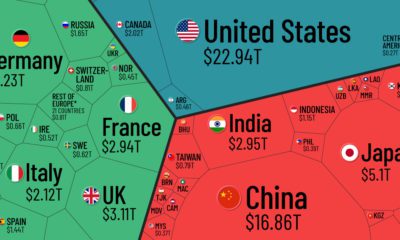
Which countries and regions contribute the most to the world economy? In this infographic, we break down all $94 trillion of global GDP by country.


 Creator Program