Mapped: Europe’s GDP Per Capita, by Country
The Growth of a $1,000 Equity Investment, by Stock Market
Mapped: The Most Valuable Company in Each Southeast Asian Country
Visualizing Global Inflation Forecasts (2024-2026)
The World’s Fastest Growing Emerging Markets (2024-2029 Forecast)
Countries With the Highest Rates of Crypto Ownership
Mapped: The Number of AI Startups By Country
All of the Grants Given by the U.S. CHIPS Act
Visualizing AI Patents by Country
How Tech Logos Have Evolved Over Time
Charted: What Frustrates Americans About the Tax System
Ranked: The Top 20 Countries in Debt to China
Charted: Which Country Has the Most Billionaires in 2024?
Charted: Which City Has the Most Billionaires in 2024?
Charted: Who Has Savings in This Economy?
Life Expectancy by Region (1950-2050F)
What Causes Preventable Child Deaths?
The Cost of an EpiPen in Major Markets
Charted: Global Tobacco Use by Country and Sex
Visualized: What Lives in Your Gut Microbiome?
Who’s Building the Most Solar Energy?
Mapped: The Age of Energy Projects in Interconnection Queues, by State
Ranked: The Top 10 EV Battery Manufacturers in 2023
The World’s Biggest Nuclear Energy Producers
The World’s Biggest Oil Producers in 2023
The Largest Earthquakes in the New York Area (1970-2024)
Mapped: Average Wages Across Europe
Mapped: Asia’s Population Patterns by Density
A Map of Global Happiness By Country in 2024
Mapped: Population Growth by Region (1900-2050F)
Visualizing Global Gold Production in 2023
Gold vs. S&P 500: Which Has Grown More Over Five Years?
Charted: The Value Gap Between the Gold Price and Gold Miners
Charted: Global Uranium Reserves, by Country
The Carbon Footprint of Major Travel Methods
Ranking the Top 15 Countries by Carbon Tax Revenue
Ranked: The Countries With the Most Air Pollution in 2023
Top Countries By Forest Growth Since 2001
Ranked: Top Countries by Total Forest Loss Since 2001
The history of Europe is breathtakingly complex, but this animation helps makes sense of 2,400 years of change on the European map.
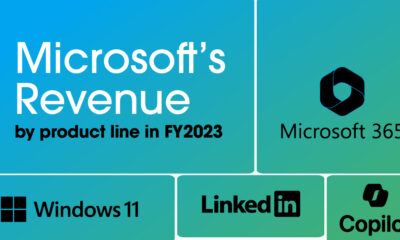
This graphic breaks down Microsoft's revenue by segment—from cloud office software to AI search engine capabilities in 2023.
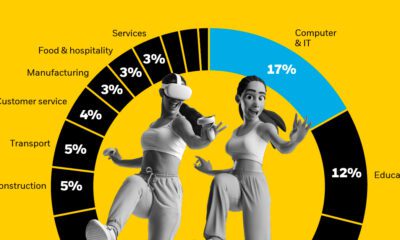
The metaverse could impact over 80% of commerce by 2030 and potentially contribute $5 trillion to the global economy.
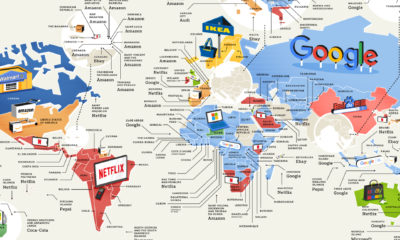
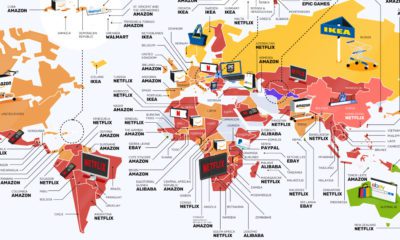
From Netflix to IKEA, this map of the world highlights the most searched for consumer brands around the world.
From Apple to Zara, this unique map showcases which popular consumer brands were searched for the most around the world.
With some esports companies more valuable than traditional sports teams, we visualize esports vs sports in franchise value.
Everything from Pong to the rise of mobile gaming and AR/VR. Learn about the $100 billion video games market in this giant infographic.
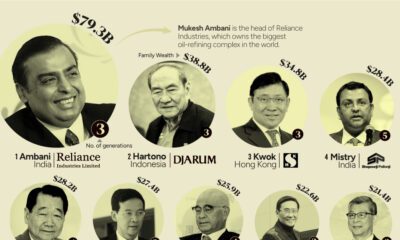
This graphic shows the 15 richest families in Asia. From energy to banking, these dynasties have built fortunes across many sectors.
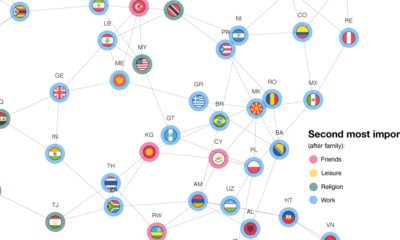
Where you're from greatly influencers how you view the world. Here's a look at the core values in 94 different countries.
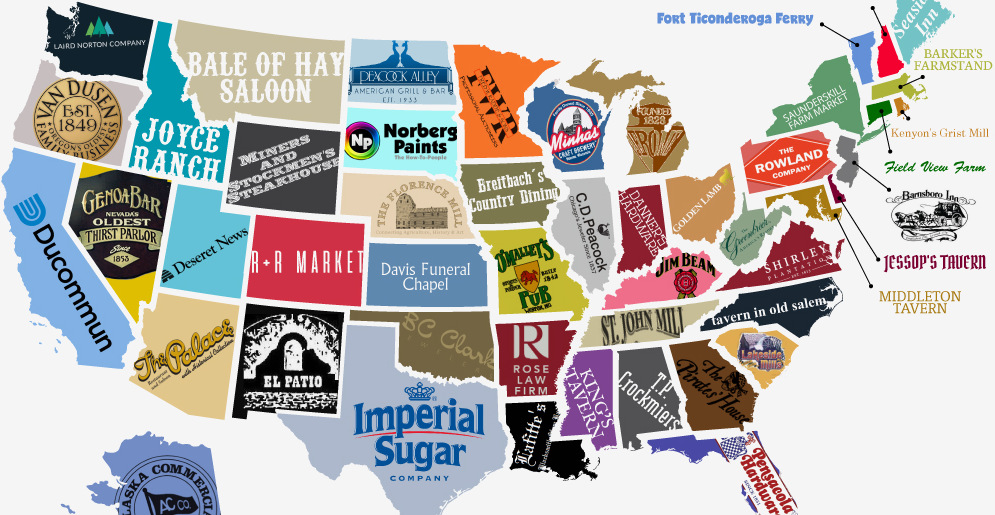
Is the oldest business in your state a well-known brand, or a mom-and-pop shop? This infographic shows the oldest company in each state in the U.S.


 Creator Program