Mapped: Europe’s GDP Per Capita, by Country
The Growth of a $1,000 Equity Investment, by Stock Market
Mapped: The Most Valuable Company in Each Southeast Asian Country
Visualizing Global Inflation Forecasts (2024-2026)
The World’s Fastest Growing Emerging Markets (2024-2029 Forecast)
Mapped: The Number of AI Startups By Country
All of the Grants Given by the U.S. CHIPS Act
Visualizing AI Patents by Country
How Tech Logos Have Evolved Over Time
Ranked: Semiconductor Companies by Industry Revenue Share
Ranked: The Top 20 Countries in Debt to China
Charted: Which Country Has the Most Billionaires in 2024?
Charted: Which City Has the Most Billionaires in 2024?
Charted: Who Has Savings in This Economy?
How Debt-to-GDP Ratios Have Changed Since 2000
Life Expectancy by Region (1950-2050F)
What Causes Preventable Child Deaths?
The Cost of an EpiPen in Major Markets
Charted: Global Tobacco Use by Country and Sex
Visualized: What Lives in Your Gut Microbiome?
Who’s Building the Most Solar Energy?
Mapped: The Age of Energy Projects in Interconnection Queues, by State
Ranked: The Top 10 EV Battery Manufacturers in 2023
The World’s Biggest Nuclear Energy Producers
The World’s Biggest Oil Producers in 2023
The Largest Earthquakes in the New York Area (1970-2024)
Mapped: Average Wages Across Europe
Mapped: Asia’s Population Patterns by Density
A Map of Global Happiness By Country in 2024
Mapped: Population Growth by Region (1900-2050F)
Visualizing Global Gold Production in 2023
Gold vs. S&P 500: Which Has Grown More Over Five Years?
Charted: The Value Gap Between the Gold Price and Gold Miners
Charted: Global Uranium Reserves, by Country
The Carbon Footprint of Major Travel Methods
Ranking the Top 15 Countries by Carbon Tax Revenue
Ranked: The Countries With the Most Air Pollution in 2023
Top Countries By Forest Growth Since 2001
Ranked: Top Countries by Total Forest Loss Since 2001
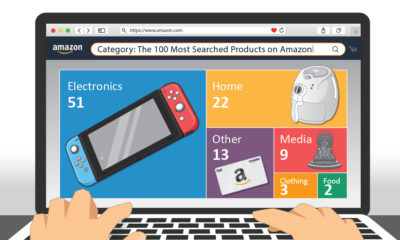
This graphic highlights the top product searches on Amazon in the U.S., providing a glimpse of what items American consumers are after.
In this visual, we've ranked the top U.S. metropolitan areas in terms of their GDP. How does your city rank?
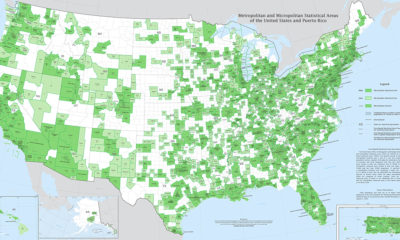
Fitting a complex population center into a tidy statistical box is no easy feat. Thankfully, this U.S. Census Bureau map is up to the challenge.
This graphic compares the cost of living and purchasing power of 578 cities worldwide, using New York City as a benchmark for comparison.
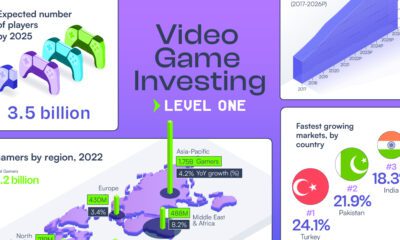
With 3.2 billion global gamers and $227 billion projected revenue in 2023, the video games industry presents diverse investment chances.
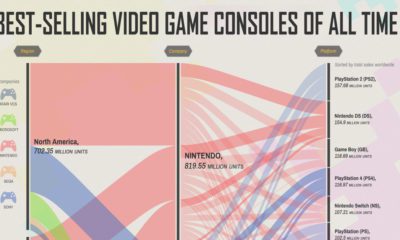
Video game consoles have changed drastically over the last 50 years. Here are some of the best-selling ones across the globe.
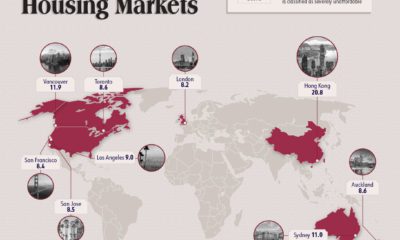
For the 10th consecutive year, Hong Kong ranks as the least affordable city. Vancouver Canada is the second, followed by Sydney, Australia.
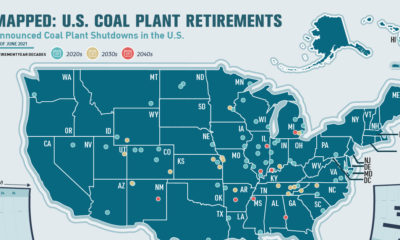
This infographic highlights announced coal plant closures in the U.S. and how much power will be affected.
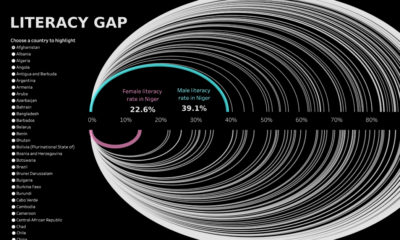
Global literacy rates have increased in the last few decades, but some countries are still lagging behind, especially in Sub-Saharan Africa.
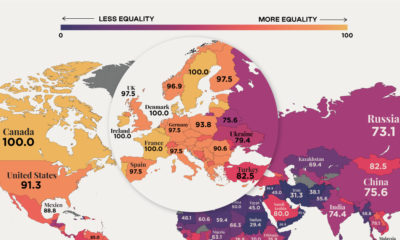
In recent years, many economies have made women’s rights a priority, yet only 10 countries in the world offer full legal protections to women.


 Creator Program