Comparing Saudi Aramco’s $1.9T Valuation to Its Rivals
The Top Retailers in the World, by Store Count
Visualizing Berkshire Hathaway’s Stock Portfolio (Q1 2024)
Nvidia is Worth More Than All of These Companies Combined
Which Retailers Operate in the Most Countries?
What Laptop Brands do Americans Use in 2024?
Ranked: The Top Startup Cities Around the World
Visualizing the 5 Most Common Cybersecurity Mistakes
Countries With the Highest Rates of Crypto Ownership
Mapped: The Income a Family Needs to Live Comfortably in Every U.S. State
Top 10 Countries Most in Debt to the IMF
Visualizing America’s Average Retirement Savings, by Age
Visualizing the Tax Burden of Every U.S. State
Charted: What Frustrates Americans About the Tax System
Visualizing Daily Protein Sources by Region
Mapped: Countries Where Recreational Cannabis is Legal
Which Countries Have the Highest Infant Mortality Rates?
Life Expectancy by Region (1950-2050F)
What Causes Preventable Child Deaths?
Ranked: The World’s Largest Lithium Producers in 2023
Who’s Building the Most Solar Energy?
Mapped: The Age of Energy Projects in Interconnection Queues, by State
Ranked: The Top 10 EV Battery Manufacturers in 2023
Mapped: The World’s Largest Armies in 2024
Mapped: Chinese Provinces With Cities Over 1 Million People
Map: Where Are America’s Largest Landfills?
Mapped: The World’s Wettest and Driest Countries
Visualizing Cobalt Production by Country in 2023
The Biggest Salt Producing Countries in 2023
Visualizing Copper Production by Country in 2023
Where the World’s Aluminum is Smelted, by Country
How People Get Around in America, Europe, and Asia
The Carbon Footprint of Major Travel Methods
Ranking the Top 15 Countries by Carbon Tax Revenue
Ranked: The Countries With the Most Air Pollution in 2023
Top Countries By Forest Growth Since 2001
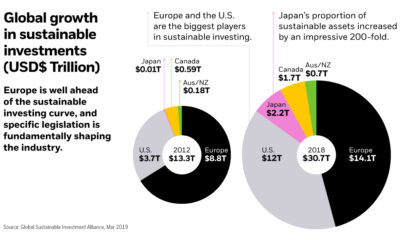
Total assets in sustainable investing reached nearly $31 trillion in 2018. What are the driving forces behind the global rise of sustainable investing?
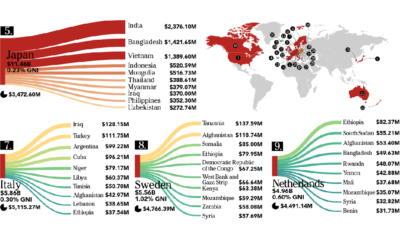
This infographic looks at who is giving – and who is receiving – the billions of dollars in foreign aid that flows between countries each year.
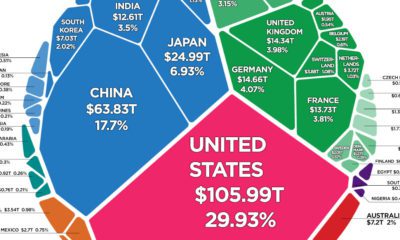
There is $360.6 trillion of wealth globally. This graphic shows how it breaks down by country, to show who owns all of the world's wealth.
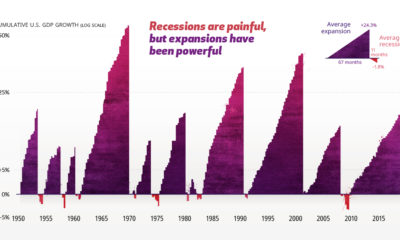
The economic cycle is a series of peaks and valleys. Analyzing economic data going back to 1950 helps put recessions into perspective.
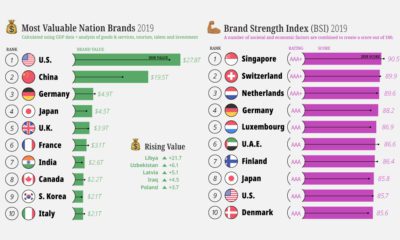
A country's national image can have a big impact on its economic fortunes. See which countries have the highest ranked nation brands.
Every day, global trends are reshaping society and the business landscape. Here are 10 insights into how the world is changing—and where we are heading.
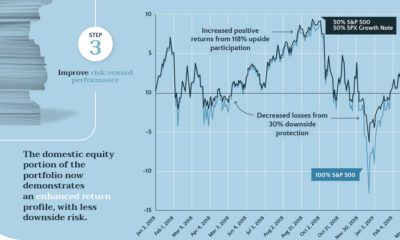
Structured notes provide some downside protection, while allowing investors to participate in market upswings. Learn all about them in this infographic.
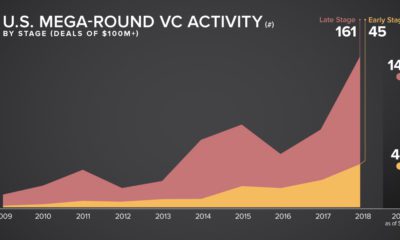
With bigger deals and multi-billion dollar IPOs, venture capital financing is reaching new heights. This infographic explores the latest trends.
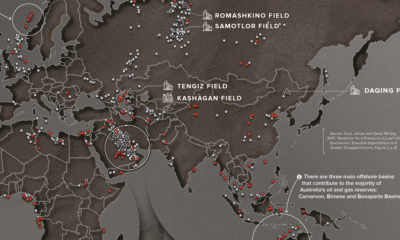
Since 1868, there had been 1,232 oil discoveries over 500 million barrels of oil. This map plots these discoveries to reveal global energy hot spots.
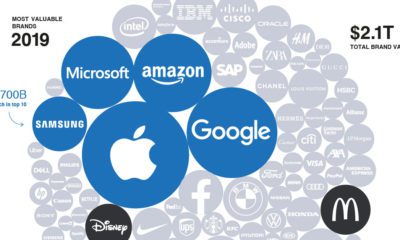
Changing consumer expectations have created a harsh environment for traditional brands to operate in—will tech companies make them obsolete?