Maps
Map: Where Are America’s Largest Landfills?
![]() See this visualization first on the Voronoi app.
See this visualization first on the Voronoi app.
Map: Where Are America’s Largest Landfills?
This was originally posted on our Voronoi app. Download the app for free on Apple or Android and discover incredible data-driven charts from a variety of trusted sources.
We map out America’s largest landfills, based on their total capacity (measured in millions of tons) for solid waste. Data for this graphic is sourced from Statista and is current up to 2023.
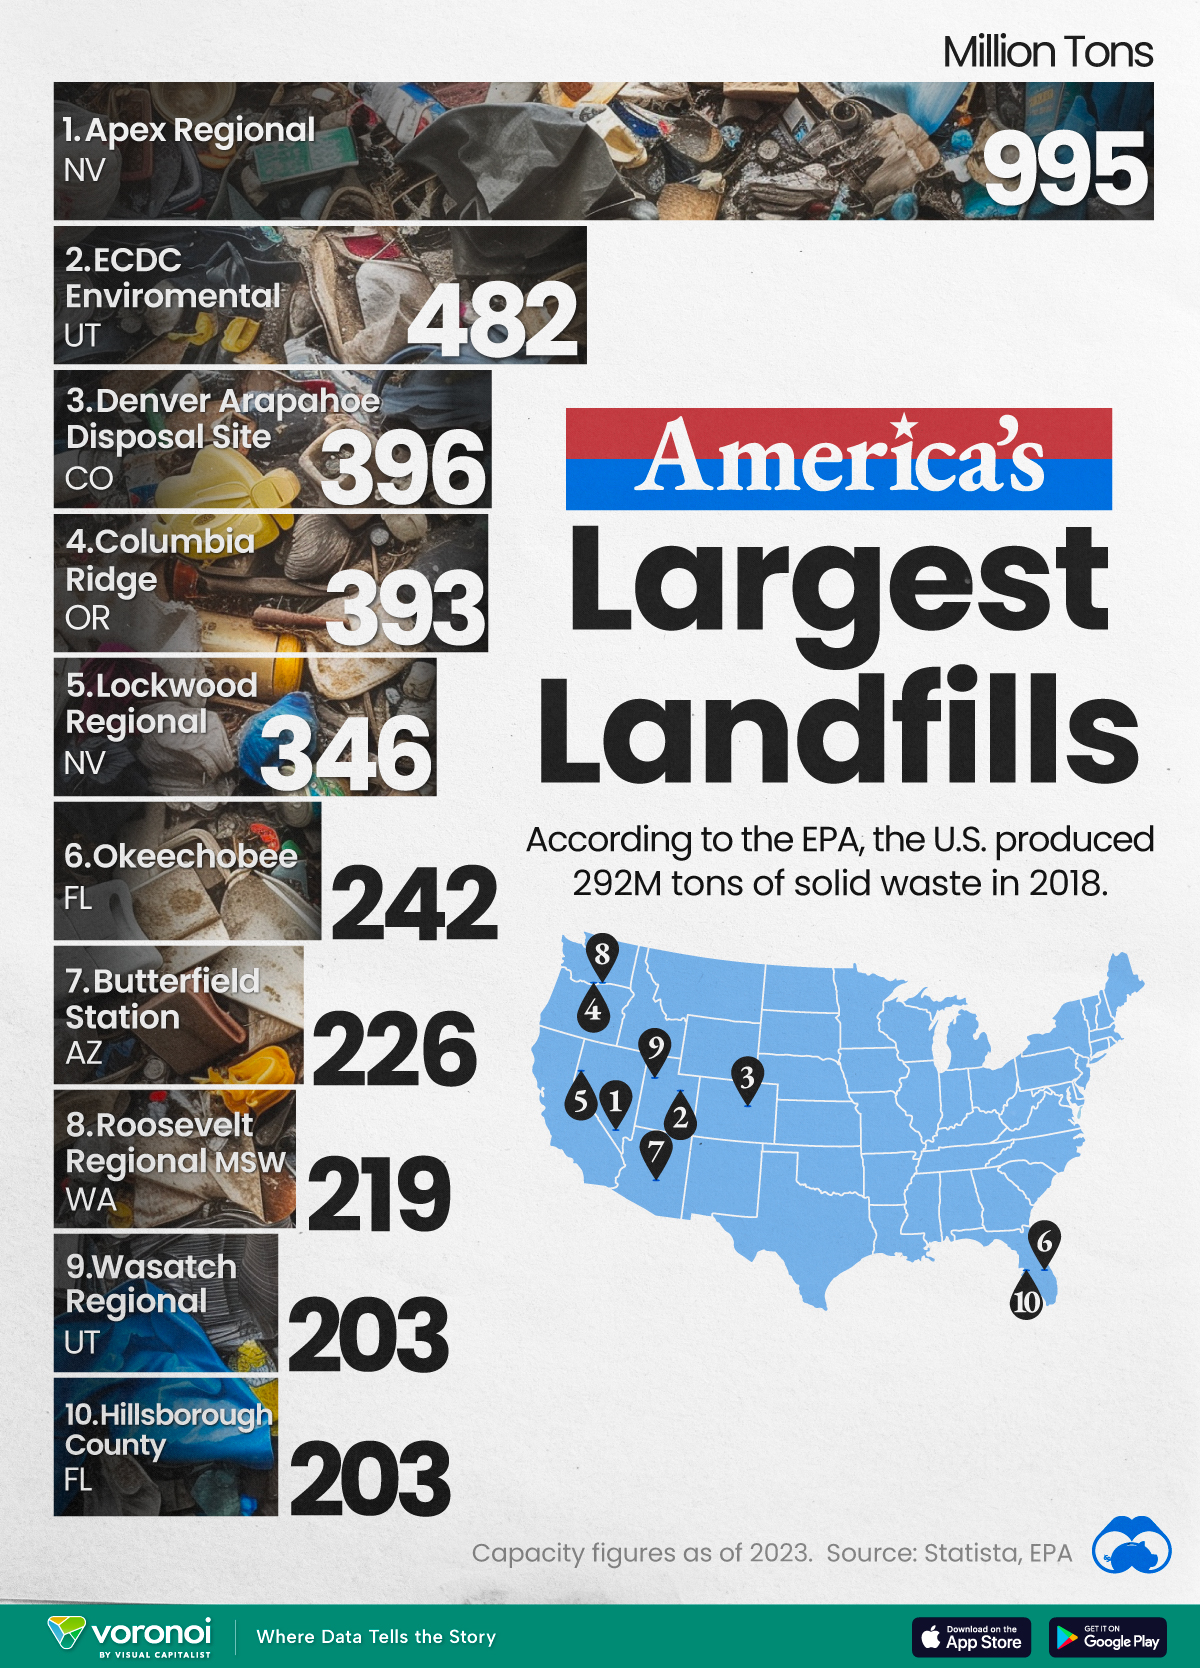
According to the EPA, the U.S. produced 292 million tons of solid waste in 2018. Of that, about 150 million tons headed to the country’s landfills. It would take more than 600 of the largest cargo ships (by dead weight tonnage) to move this much material at once.
Ranked: America’s Largest Landfills
Opened in 1993 and located 25 minutes from Las Vegas, Apex Landfill is believed to be one of the world’s largest landfills by both area and volume.
It spans 1,900 acres, or roughly the size of 1,400 football fields. Given its vast capacity, the landfill is expected to be able to accept waste for over 250 years.
Here are the top 10 largest landfills in the country.
| Rank | U.S. Landfill | State | Capacity (Million Tons) |
|---|---|---|---|
| 1 | Apex Regional | Nevada | 995 |
| 2 | ECDC Environmental | Utah | 482 |
| 3 | Denver Arapahoe Disposal Site | Colorado | 396 |
| 4 | Columbia Ridge | Oregon | 393 |
| 5 | Lockwood Regional | Nevada | 346 |
| 6 | Okeechobee | Florida | 242 |
| 7 | Butterfield Station | Arizona | 226 |
| 8 | Roosevelt Regional MSW | Washington | 219 |
| 9 | Wasatch Regional | Utah | 203 |
| 10 | Hillsborough County | Florida | 203 |
In a 2021 PBS interview, a spokesperson for Apex Landfill reported that the facility captured and treated enough landfill gas to power nearly 11,000 homes in Southern Nevada.
In fact, landfills can create electricity through a process called landfill gas (LFG) recovery. When organic waste decomposes, it produces methane gas which can be captured and purified to create fuel for generators.
As it happens, methane gas from landfills is the third-largest source of human-related carbon emissions, equivalent to 24 million gas passenger vehicles driven for one year. Its capture and treatment is a significant opportunity to combat emissions.


Countries
Mapped: The Population of China and India in Perspective
We compare the populations of India and China to other top countries and regions for a unique perspective on the world’s demographics.


The Population of China and India in Perspective
This was originally posted on our Voronoi app. Download the app for free on iOS or Android and discover incredible data-driven charts from a variety of trusted sources.
China and India, the world’s two most populous countries, each boast populations exceeding 1.4 billion people.
To put this into perspective, we visualized populations of China and India beside other leading countries and regions. All figures are for 2023, and were accessed via Worldometer.
Data and Key Takeaways
All of the data we used to create this graphic is listed in the table below.
| Country / Region | Population (2023) |
|---|---|
| 🌍 Africa | 1,460,481,772 |
| 🇮🇳 India | 1,428,627,663 |
| 🇨🇳 China | 1,425,671,352 |
| 🌎 Latin America & the Caribbean | 664,997,121 |
| 🇪🇺🇬🇧 EU plus UK | 516,659,018 |
| 🇺🇸 U.S. | 339,996,563 |
| 🇮🇩 Indonesia | 277,534,122 |
From these figures, we can see that the entire population of Africa (currently the fastest growing region in the world) barely surpasses that of China and India.
The populations of China and India are each more than double the size of Latin America and the Caribbean, and nearly triple that of the European Union (including the UK).
Fast Facts on Global Population
Here are some important figures to know regarding the world’s population:
- China accounts for 17.7% of the world’s population, while India represents a slightly larger 17.8% share.
- Africa is the fastest growing region in the world, with annual growth of about 2.4%.
- Europe is the only region in the world that is shrinking, at about -0.17% annually.
Learn More About Demographics from Visual Capitalist
If you enjoy graphics like these, be sure to check out Population Projections: The World’s 6 Largest Countries in 2075.
It reveals a startling contrast between the trajectories of China and India, with the latter peaking at 1.7 billion in the mid-2060s.

-

 United States6 days ago
Ranked: U.S. Cities with the Highest Rent in 2024
-

 Globalization2 weeks ago
Charted: Countries Offering Digital Nomad Visas
-

 Politics2 weeks ago
Mapped: Unauthorized Immigrants by State
-

 Technology1 week ago
Visualizing the 15 Most Valuable Bitcoin Addresses
-

 Demographics1 week ago
Which Countries Have the Most and Least Women in the Workforce?
-

 Mining1 week ago
Visualizing Raw Steel Production in 2023
-

 Crime1 week ago
Charted: The World’s Highest Homicide Rates, in Each Region
-

 United States1 week ago
Wildfire Area Burned by U.S. State in 2023