Maps
Mapped: The World’s Wettest and Driest Countries
![]() See this visualization first on the Voronoi app.
See this visualization first on the Voronoi app.
Where are the World’s Wettest and Driest Countries?
This was originally posted on our Voronoi app. Download the app for free on iOS or Android and discover incredible data-driven charts from a variety of trusted sources.
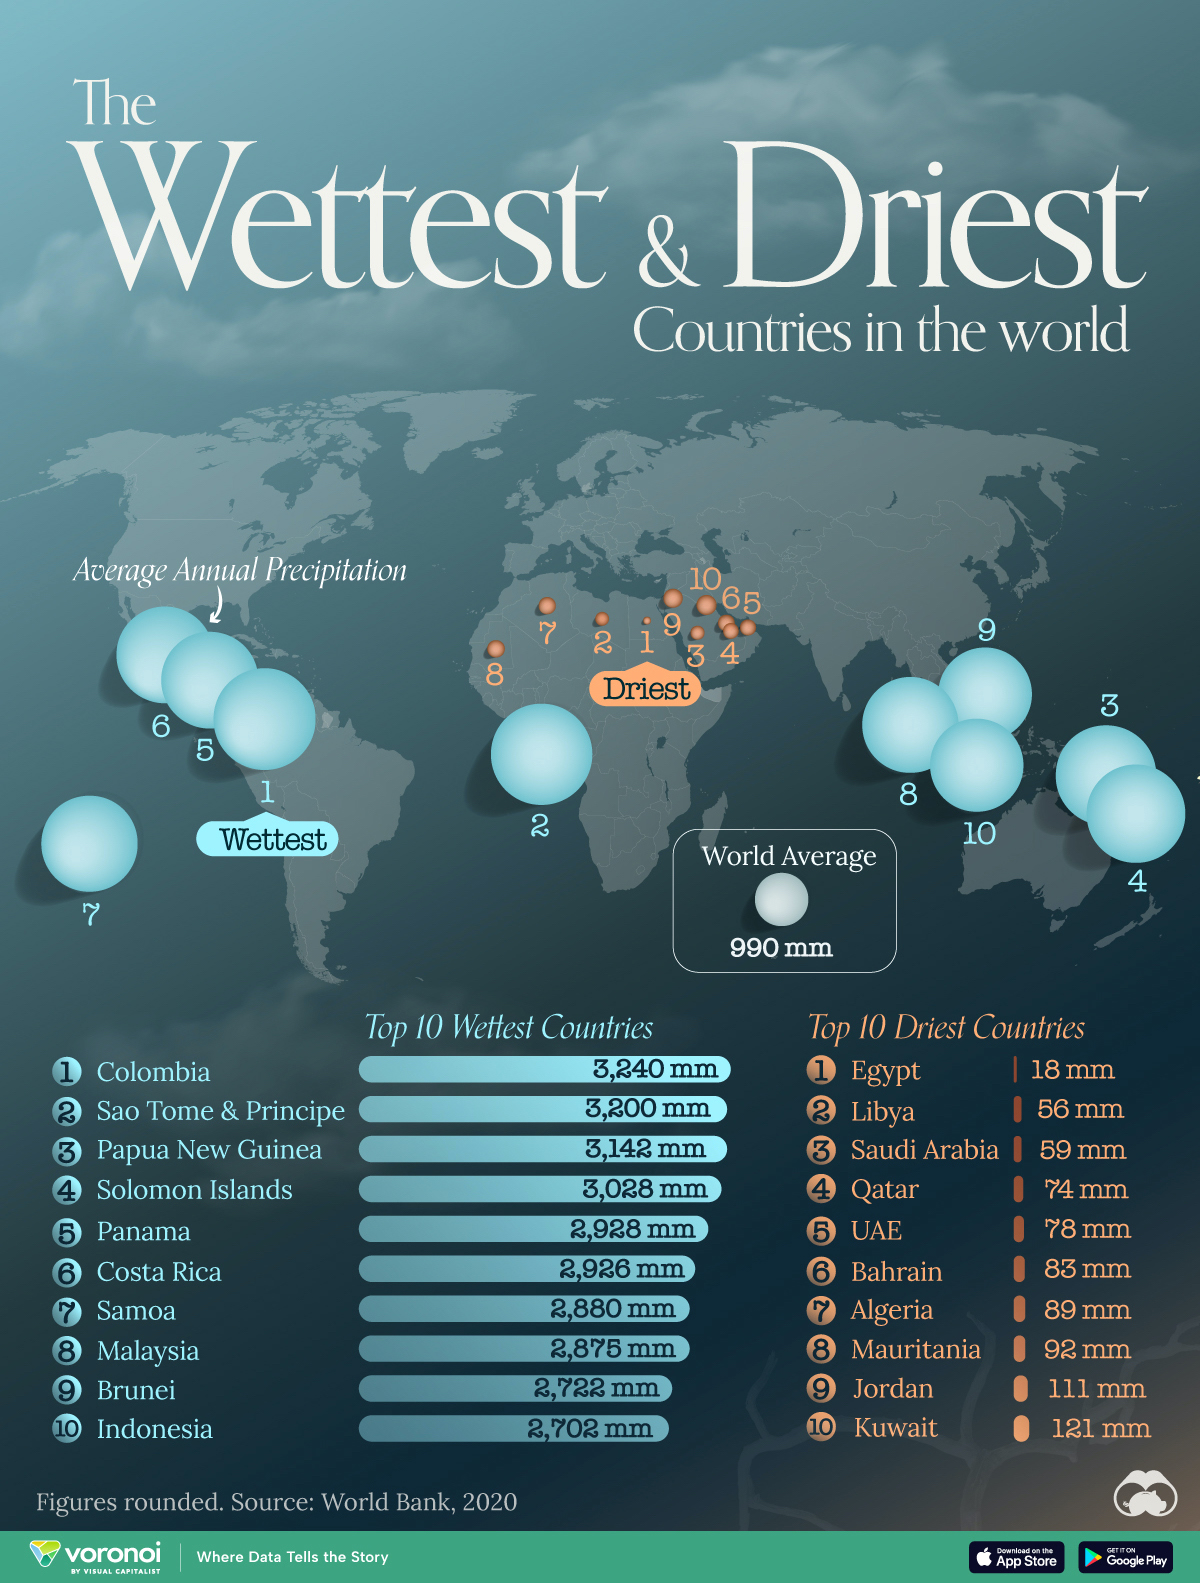
From tropical rainforest nations to the sandy deserts of North Africa and the Middle East, the world’s wettest and driest countries are a study in contrasts.
We map and rank the countries that receive the highest and lowest average annual precipitation in millimeters, per latest data from the World Bank.
Ranked: Top 10 Wettest Countries
Colombia tops the list of nations with the highest average precipitation at 3,240 millimeters (128 inches) in a year.
Its Tutunendo district is the one of the world’s wettest places, averaging nearly 12,000 mm (463 inches) of rain annually.
| Rank | Country | Average Annual Precipitation (mm) |
|---|---|---|
| 1 | 🇨🇴 Colombia | 3,240 |
| 2 | 🇸🇹 Sao Tome & Principe | 3,200 |
| 3 | 🇵🇬 Papua New Guinea | 3,142 |
| 4 | 🇸🇧 Solomon Islands | 3,028 |
| 5 | 🇵🇦 Panama | 2,928 |
| 6 | 🇨🇷 Costa Rica | 2,926 |
| 7 | 🇼🇸 Samoa | 2,880 |
| 8 | 🇲🇾 Malaysia | 2,875 |
| 9 | 🇧🇳 Brunei | 2,722 |
| 10 | 🇮🇩 Indonesia | 2,702 |
Note: Figures are rounded.
Off the coast of Africa however, Sao Tome & Principe is not far behind Colombia, receiving about 3,200 mm of rain in 2020.
Papua New Guinea and the Solomon Islands also average more than 3,000 mm of rain in a year, and Panama (2,928 mm) rounds out the top five.
Noticeably, all 10 countries lie in close proximity to the equator, and near oceans, where rising hot and humid air leads to abundant rainfall.
Ranked: Top 10 Driest Countries
On the other end of the scale, Egypt records the lowest average annual rainfall across all countries, at 18 mm (0.7 inches). For comparison, Colombia receives nearly 180x the amount of rain Egypt does.
| Rank | Country | Average Annual Precipitation (mm) |
|---|---|---|
| 1 | 🇪🇬 Egypt | 18 |
| 2 | 🇱🇾 Libya | 56 |
| 3 | 🇸🇦 Saudi Arabia | 59 |
| 4 | 🇶🇦 Qatar | 74 |
| 5 | 🇦🇪 UAE | 78 |
| 6 | 🇧🇭 Bahrain | 83 |
| 7 | 🇩🇿 Algeria | 89 |
| 8 | 🇲🇷 Mauritania | 92 |
| 9 | 🇯🇴 Jordan | 111 |
| 10 | 🇰🇼 Kuwait | 121 |
Note: Figures are rounded.
In fact, countries from North Africa and the Middle East make up the entirety of this list of the driest countries in the world.
Learn More About Rainfall From Visual Capitalist
If you enjoyed this post, be sure to check out Mapping the Unequal Distribution of Global Precipitation which divides the world into two halves: one that receives more than global average of rain (or snow), and one that receives less.


Countries
Mapped: The Population of China and India in Perspective
We compare the populations of India and China to other top countries and regions for a unique perspective on the world’s demographics.


The Population of China and India in Perspective
This was originally posted on our Voronoi app. Download the app for free on iOS or Android and discover incredible data-driven charts from a variety of trusted sources.
China and India, the world’s two most populous countries, each boast populations exceeding 1.4 billion people.
To put this into perspective, we visualized populations of China and India beside other leading countries and regions. All figures are for 2023, and were accessed via Worldometer.
Data and Key Takeaways
All of the data we used to create this graphic is listed in the table below.
| Country / Region | Population (2023) |
|---|---|
| 🌍 Africa | 1,460,481,772 |
| 🇮🇳 India | 1,428,627,663 |
| 🇨🇳 China | 1,425,671,352 |
| 🌎 Latin America & the Caribbean | 664,997,121 |
| 🇪🇺🇬🇧 EU plus UK | 516,659,018 |
| 🇺🇸 U.S. | 339,996,563 |
| 🇮🇩 Indonesia | 277,534,122 |
From these figures, we can see that the entire population of Africa (currently the fastest growing region in the world) barely surpasses that of China and India.
The populations of China and India are each more than double the size of Latin America and the Caribbean, and nearly triple that of the European Union (including the UK).
Fast Facts on Global Population
Here are some important figures to know regarding the world’s population:
- China accounts for 17.7% of the world’s population, while India represents a slightly larger 17.8% share.
- Africa is the fastest growing region in the world, with annual growth of about 2.4%.
- Europe is the only region in the world that is shrinking, at about -0.17% annually.
Learn More About Demographics from Visual Capitalist
If you enjoy graphics like these, be sure to check out Population Projections: The World’s 6 Largest Countries in 2075.
It reveals a startling contrast between the trajectories of China and India, with the latter peaking at 1.7 billion in the mid-2060s.

-

 Automotive5 days ago
Mapped: Where Tesla and BYD Make Their Cars
-

 Technology2 weeks ago
Charted: How Many Data Centers do Major Big Tech Companies Have?
-

 Globalization2 weeks ago
Charted: Countries Offering Digital Nomad Visas
-

 Politics1 week ago
Mapped: Unauthorized Immigrants by State
-

 Technology1 week ago
Visualizing the 15 Most Valuable Bitcoin Addresses
-

 Demographics1 week ago
Which Countries Have the Most and Least Women in the Workforce?
-

 Mining1 week ago
Visualizing Raw Steel Production in 2023
-

 Crime1 week ago
Charted: The World’s Highest Homicide Rates, in Each Region