Personal Finance
Mapped: The Income a Family Needs to Live Comfortably in Every U.S. State
![]() See this visualization first on the Voronoi app.
See this visualization first on the Voronoi app.
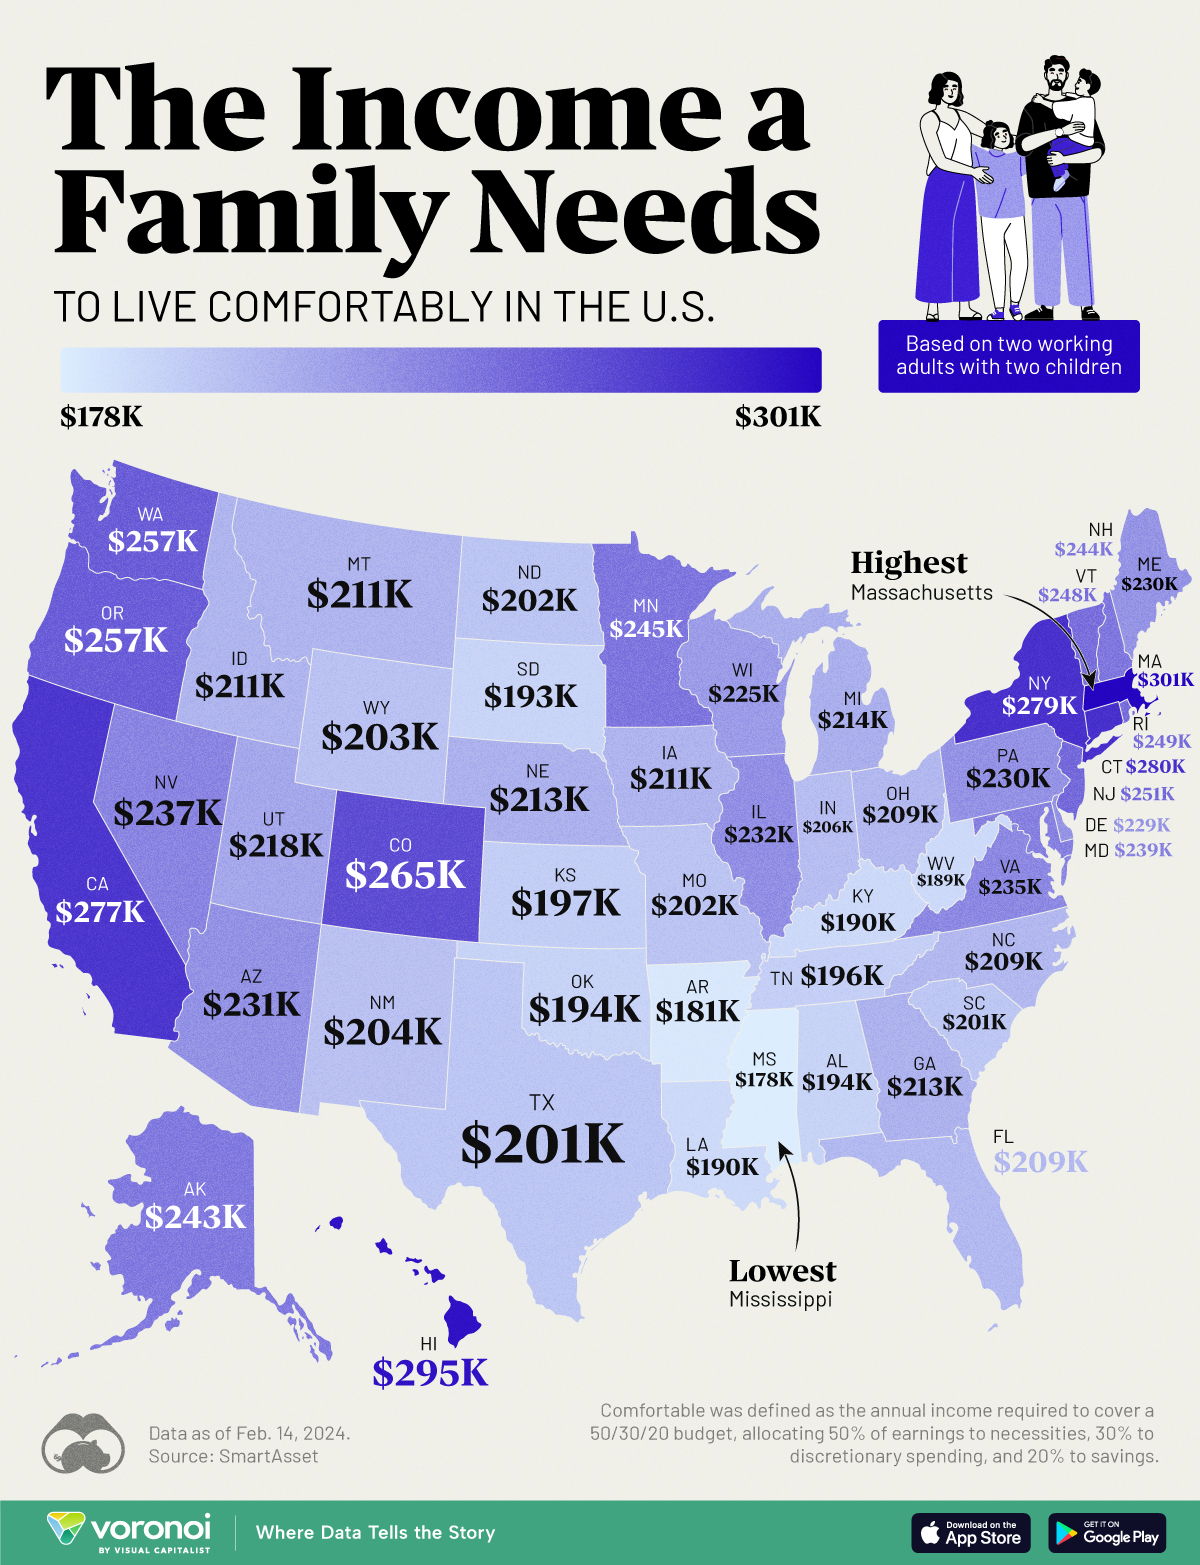
The Income a Family Needs to Live Comfortably in Every U.S. State
This was originally posted on our Voronoi app. Download the app for free on iOS or Android and discover incredible data-driven charts from a variety of trusted sources.
Families in the top five most expensive U.S. states require an annual income exceeding $270,000 to live comfortably.
This visualization illustrates the income necessary for two working adults with two children to maintain a comfortable lifestyle in each state.
“Comfortable” is defined as the income needed to cover a 50/30/20 budget, with 50% allocated to necessities like housing and utilities, 30% to discretionary spending, and 20% to savings or investments.
The calculations for family income needed in each state were done by SmartAsset, using the cost of necessities sourced from the MIT Living Wage Calculator, last updated on Feb. 14, 2024.
Massachusetts Tops the List
Massachusetts is the most expensive state to live comfortably in, requiring a total family income of about $301,184. Hawaii ($294,611) comes in second, followed by Connecticut ($279,885).
Housing is one main reason Massachusetts is an expensive state to live in, particularly in the Boston area. In addition, the state also has a high cost of living, including expenses such as healthcare and utilities.
| Rank | State | Income for 2 working adults raising 2 children |
|---|---|---|
| 1 | Massachusetts | $301,184 |
| 2 | Hawaii | $294,611 |
| 3 | Connecticut | $279,885 |
| 4 | New York | $278,970 |
| 5 | California | $276,723 |
| 6 | Colorado | $264,992 |
| 7 | Washington | $257,421 |
| 8 | Oregon | $257,338 |
| 9 | New Jersey | $251,181 |
| 10 | Rhode Island | $249,267 |
| 11 | Vermont | $248,352 |
| 12 | Minnesota | $244,774 |
| 13 | New Hampshire | $244,109 |
| 14 | Alaska | $242,611 |
| 15 | Maryland | $239,450 |
| 16 | Nevada | $237,286 |
| 17 | Virginia | $235,206 |
| 18 | Illinois | $231,962 |
| 19 | Arizona | $230,630 |
| 20 | Pennsylvania | $230,464 |
| 21 | Maine | $229,549 |
| 22 | Delaware | $228,966 |
| 23 | Wisconsin | $225,056 |
| 24 | Utah | $218,483 |
| 25 | Michigan | $214,490 |
| 26 | Nebraska | $213,075 |
| 27 | Georgia | $212,826 |
| 28 | Montana | $211,411 |
| 28 | Iowa | $211,411 |
| 30 | Idaho | $211,245 |
| 31 | North Carolina | $209,331 |
| 31 | Ohio | $209,331 |
| 33 | Florida | $209,082 |
| 34 | Indiana | $206,003 |
| 35 | New Mexico | $203,923 |
| 36 | Wyoming | $203,424 |
| 37 | Missouri | $202,259 |
| 38 | North Dakota | $202,176 |
| 39 | Texas | $201,344 |
| 40 | South Carolina | $200,762 |
| 41 | Kansas | $196,768 |
| 42 | Tennessee | $195,770 |
| 43 | Oklahoma | $194,106 |
| 44 | Alabama | $193,606 |
| 45 | South Dakota | $192,608 |
| 46 | Kentucky | $190,112 |
| 47 | Louisiana | $189,613 |
| 48 | West Virginia | $189,363 |
| 49 | Arkansas | $180,794 |
| 50 | Mississippi | $177,798 |
Meanwhile, Mississippi is the least expensive state for a family to live comfortably, requiring $177,798 per year. Arkansas ($180,794) comes in second, followed by West Virginia ($189,363). In common, all these states share low prices of housing.
Learn More About Cost of Living From Visual Capitalist
If you enjoyed this post, be sure to check out this graphic, which ranks the median down payment for a house by U.S. state.


Wealth
Visualizing the Tax Burden of Every U.S. State
Tax burden measures the percent of an individual’s income that is paid towards taxes. See where it’s the highest by state in this graphic.


Visualizing the Tax Burden of Every U.S. State
This was originally posted on our Voronoi app. Download the app for free on iOS or Android and discover incredible data-driven charts from a variety of trusted sources.
This map graphic visualizes the total tax burden in each U.S. state as of March 2024, based on figures compiled by WalletHub.
It’s important to understand that under this methodology, the tax burden measures the percent of an average person’s income that is paid towards state and local taxes. It considers property taxes, income taxes, and sales & excise tax.
Data and Methodology
The figures we used to create this graphic are listed in the table below.
| State | Total Tax Burden |
|---|---|
| New York | 12.0% |
| Hawaii | 11.8% |
| Vermont | 11.1% |
| Maine | 10.7% |
| California | 10.4% |
| Connecticut | 10.1% |
| Minnesota | 10.0% |
| Illinois | 9.7% |
| New Jersey | 9.5% |
| Rhode Island | 9.4% |
| Utah | 9.4% |
| Kansas | 9.3% |
| Maryland | 9.3% |
| Iowa | 9.2% |
| Nebraska | 9.2% |
| Ohio | 8.9% |
| Indiana | 8.9% |
| Arkansas | 8.8% |
| Mississippi | 8.8% |
| Massachusetts | 8.6% |
| Virginia | 8.5% |
| West Virginia | 8.5% |
| Oregon | 8.4% |
| Colorado | 8.4% |
| Pennsylvania | 8.4% |
| Wisconsin | 8.3% |
| Louisiana | 8.3% |
| Kentucky | 8.3% |
| Washington | 8.0% |
| New Mexico | 8.0% |
| Michigan | 8.0% |
| North Carolina | 7.9% |
| Idaho | 7.9% |
| Arizona | 7.8% |
| Missouri | 7.8% |
| Georgia | 7.7% |
| Texas | 7.6% |
| Alabama | 7.5% |
| Montana | 7.5% |
| South Carolina | 7.5% |
| Nevada | 7.4% |
| Oklahoma | 7.0% |
| North Dakota | 6.8% |
| South Dakota | 6.4% |
| Delaware | 6.4% |
| Tennessee | 6.1% |
| Florida | 6.1% |
| Wyoming | 5.7% |
| New Hampshire | 5.6% |
| Alaska | 4.9% |
From this data we can see that New York has the highest total tax burden. Residents in this state will pay, on average, 12% of their income to state and local governments.
Breaking this down into its three components, the average New Yorker pays 4.6% of their income on income taxes, 4.4% on property taxes, and 3% in sales & excise taxes.
At the other end of the spectrum, Alaska has the lowest tax burden of any state, equaling 4.9% of income. This is partly due to the fact that Alaskans do not pay state income tax.
Hate Paying Taxes?
In addition to Alaska, there are several other U.S. states that don’t charge income taxes. These are: Florida, Nevada, South Dakota, Tennessee, Texas, Washington, and Wyoming.
It’s also worth noting that New Hampshire does not have a regular income tax, but does charge a flat 4% on interest and dividend income according to the Tax Foundation.
Learn More About Taxation From Visual Capitalist
If you enjoyed this post, be sure to check out this graphic which ranks the countries with the lowest corporate tax rates, from 1980 to today.

-

 Maps4 days ago
Ranked: The 10 Most Visited Countries in 2023
-

 Misc2 weeks ago
Four Decades of U.S. Wildfires (1983–2024)
-
 population2 weeks ago
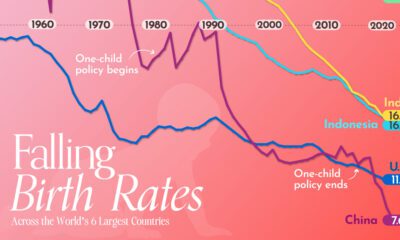
Charted: Declining Birth Rates in the Most Populous Countries (1950-Today)
-
 Technology1 week ago
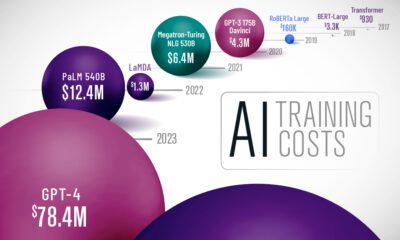
Visualizing the Training Costs of AI Models Over Time
-
 Maps1 week ago
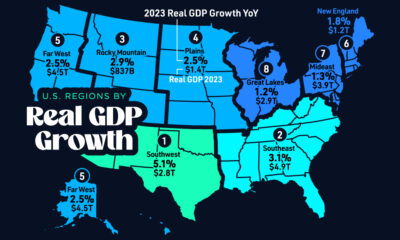
Mapped: The Real GDP Growth of U.S. Regions in 2023
-

 Technology1 week ago
Charted: How Many Data Centers do Major Big Tech Companies Have?
-

 Globalization1 week ago
Charted: Countries Offering Digital Nomad Visas
-

 Politics1 week ago
Mapped: Unauthorized Immigrants by State