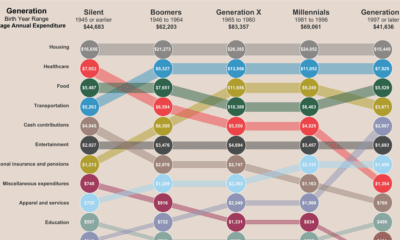

This interactive graphic shows a breakdown of how average Americans spend their money, and how expenses vary across generations.


This graphic compares the cost of living and purchasing power of 578 cities worldwide, using New York City as a benchmark for comparison.
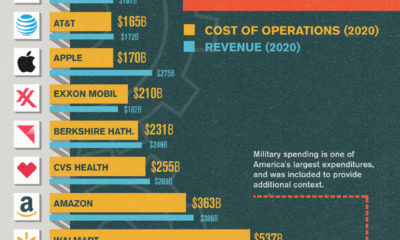

Running a Fortune 500 company is a costly endeavor. In this chart, we compare the operating costs of America's biggest names.
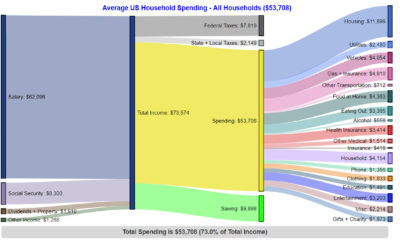

These charts break down how Americans get their income, as well as where that money goes, based on different income groups.


 Creator Program