Energy
Lithium: The Key Ingredient Powering Today’s Technology

Lithium: The Key Ingredient Powering Today’s Technology
Lithium infographic presented by: Dajin Resources
Lithium is nature’s lightest metal, but it is also one of the most chemically reactive, which makes it a key ingredient in powering and building the latest technology.
Most similar to a material such as wood in density, lithium would float on water if it didn’t react with it so intensely. The light metal even reacts with air almost instantly, turning from a silvery-white to dark grey.
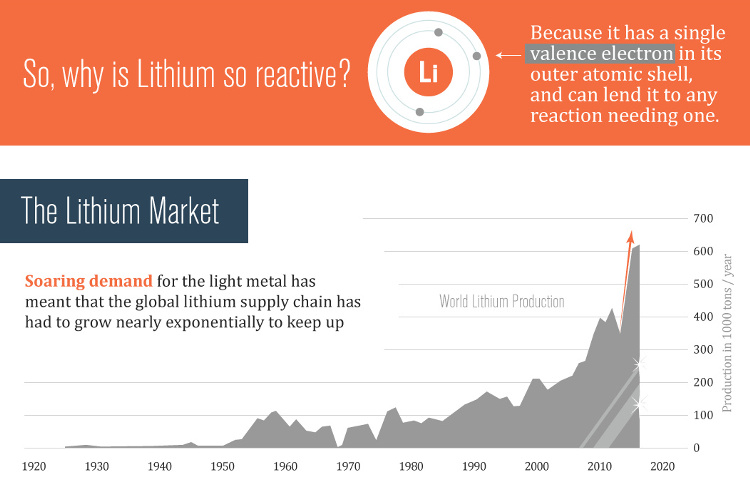
Why is lithium so reactive? It is because it has a single valence electron that it can lend to many different types of chemical reactions.
Before 1990, it was rare for more than 100,000 tonnes of lithium to be used each year. However, since then demand has skyrocketed to closer to 600,000 tonnes per year, where it is today. Lithium’s uses are split between chemical and technical, but the fastest growing segments of demand are derived from its electrochemical potential.
Lithium has the highest electric output per unit weight of any battery material, which makes it the obvious choice for energy storage in many types of technology. Electric cars, renewable energy, smart grids, and consumer electronics are all using lithium ion batteries, and these markets all show signs of growth in the future.
Furthermore, lithium has some other interesting uses as well. Recently Alcoa developed a 4th generation aluminum-lithium alloy to reduce weight of airliners. The result is a 15% fuel savings through increased fuel efficiency.
While lithium is not scarce, it does tend to be deposited in very low concentrations through many types of rocks. The biggest challenge is finding high enough concentrations to make it cost-efficient to produce. Uniquely to lithium, brine deposits can cut exploration and milling costs by up to 50%, which has priced many hard rock miners out of the market.
Brine deposits are produced mainly from salt flats, which are also known as salars. The “Lithium Triangle” is the major industrial producer of lithium and holds over 70% of global reserves. The only producing lithium mine in the United States is in Clayton Valley, Nevada in the “Lithium Hub”, which is very close to the site of Tesla’s $5 billion Gigafactory.
Lithium, because of its physical and chemical properties, is an essential ingredient powering today’s technology. Moving forward, lithium will be even more important for crucial areas such as power storage, electronics, automobiles, defense, and aerospace.
Related infographic: The Look and Feel of Canadian Venture Market Bottoms from 1981-2014
Who’s Building the Most Solar Energy?
This was originally posted on our Voronoi app. Download the app for free on iOS or Android and discover incredible data-driven charts from a variety of trusted sources.
In 2023, solar energy accounted for three-quarters of renewable capacity additions worldwide. Most of this growth occurred in Asia, the EU, and the U.S., continuing a trend observed over the past decade.
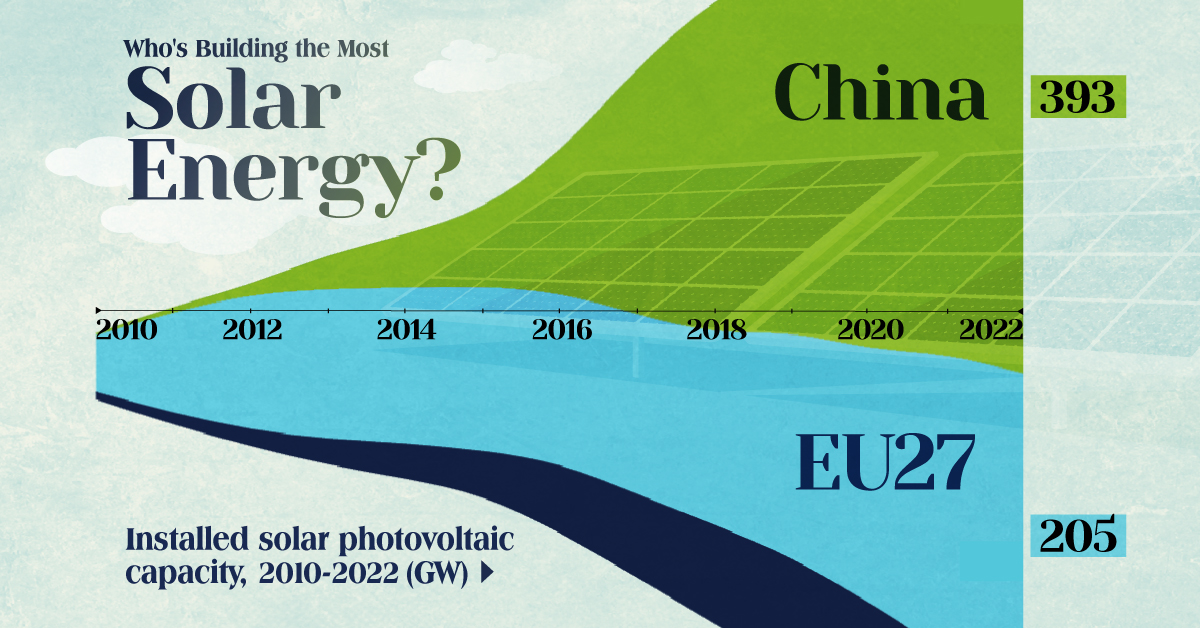
In this graphic, we illustrate the rise in installed solar photovoltaic (PV) capacity in China, the EU, and the U.S. between 2010 and 2022, measured in gigawatts (GW). Bruegel compiled the data..
Chinese Dominance
As of 2022, China’s total installed capacity stands at 393 GW, nearly double that of the EU’s 205 GW and surpassing the USA’s total of 113 GW by more than threefold in absolute terms.
| Installed solar capacity (GW) | China | EU27 | U.S. |
|---|---|---|---|
| 2022 | 393.0 | 205.5 | 113.0 |
| 2021 | 307.0 | 162.7 | 95.4 |
| 2020 | 254.0 | 136.9 | 76.4 |
| 2019 | 205.0 | 120.1 | 61.6 |
| 2018 | 175.3 | 104.0 | 52.0 |
| 2017 | 130.8 | 96.2 | 43.8 |
| 2016 | 77.8 | 91.5 | 35.4 |
| 2015 | 43.6 | 87.7 | 24.2 |
| 2014 | 28.4 | 83.6 | 18.1 |
| 2013 | 17.8 | 79.7 | 13.3 |
| 2012 | 6.7 | 71.1 | 8.6 |
| 2011 | 3.1 | 53.3 | 5.6 |
| 2010 | 1.0 | 30.6 | 3.4 |
Since 2017, China has shown a compound annual growth rate (CAGR) of approximately 25% in installed PV capacity, while the USA has seen a CAGR of 21%, and the EU of 16%.
Additionally, China dominates the production of solar power components, currently controlling around 80% of the world’s solar panel supply chain.
In 2022, China’s solar industry employed 2.76 million individuals, with manufacturing roles representing approximately 1.8 million and the remaining 918,000 jobs in construction, installation, and operations and maintenance.
The EU industry employed 648,000 individuals, while the U.S. reached 264,000 jobs.
According to the IEA, China accounts for almost 60% of new renewable capacity expected to become operational globally by 2028.
Despite the phasing out of national subsidies in 2020 and 2021, deployment of solar PV in China is accelerating. The country is expected to reach its national 2030 target for wind and solar PV installations in 2024, six years ahead of schedule.
-
 Healthcare6 days ago
Life Expectancy by Region (1950-2050F)
-

 Economy2 weeks ago
Ranked: The Top 20 Countries in Debt to China
-

 Politics2 weeks ago
Charted: Trust in Government Institutions by G7 Countries
-

 Energy2 weeks ago
Mapped: The Age of Energy Projects in Interconnection Queues, by State
-

 Mining2 weeks ago
Visualizing Global Gold Production in 2023
-

 Markets2 weeks ago
Visualized: Interest Rate Forecasts for Advanced Economies
-

 Economy1 week ago
The Most Valuable Companies in Major EU Economies
-
 Markets1 week ago
The World’s Fastest Growing Emerging Markets (2024-2029 Forecast)


