Energy
A Lifetime’s Consumption of Fossil Fuels, Visualized
![]() Subscribe to the Elements free mailing list for more like this
Subscribe to the Elements free mailing list for more like this
Visualizing the Fossil Fuels we Consume in a Lifetime
This was originally posted on Elements. Sign up to the free mailing list to get beautiful visualizations on natural resource megatrends in your email every week.
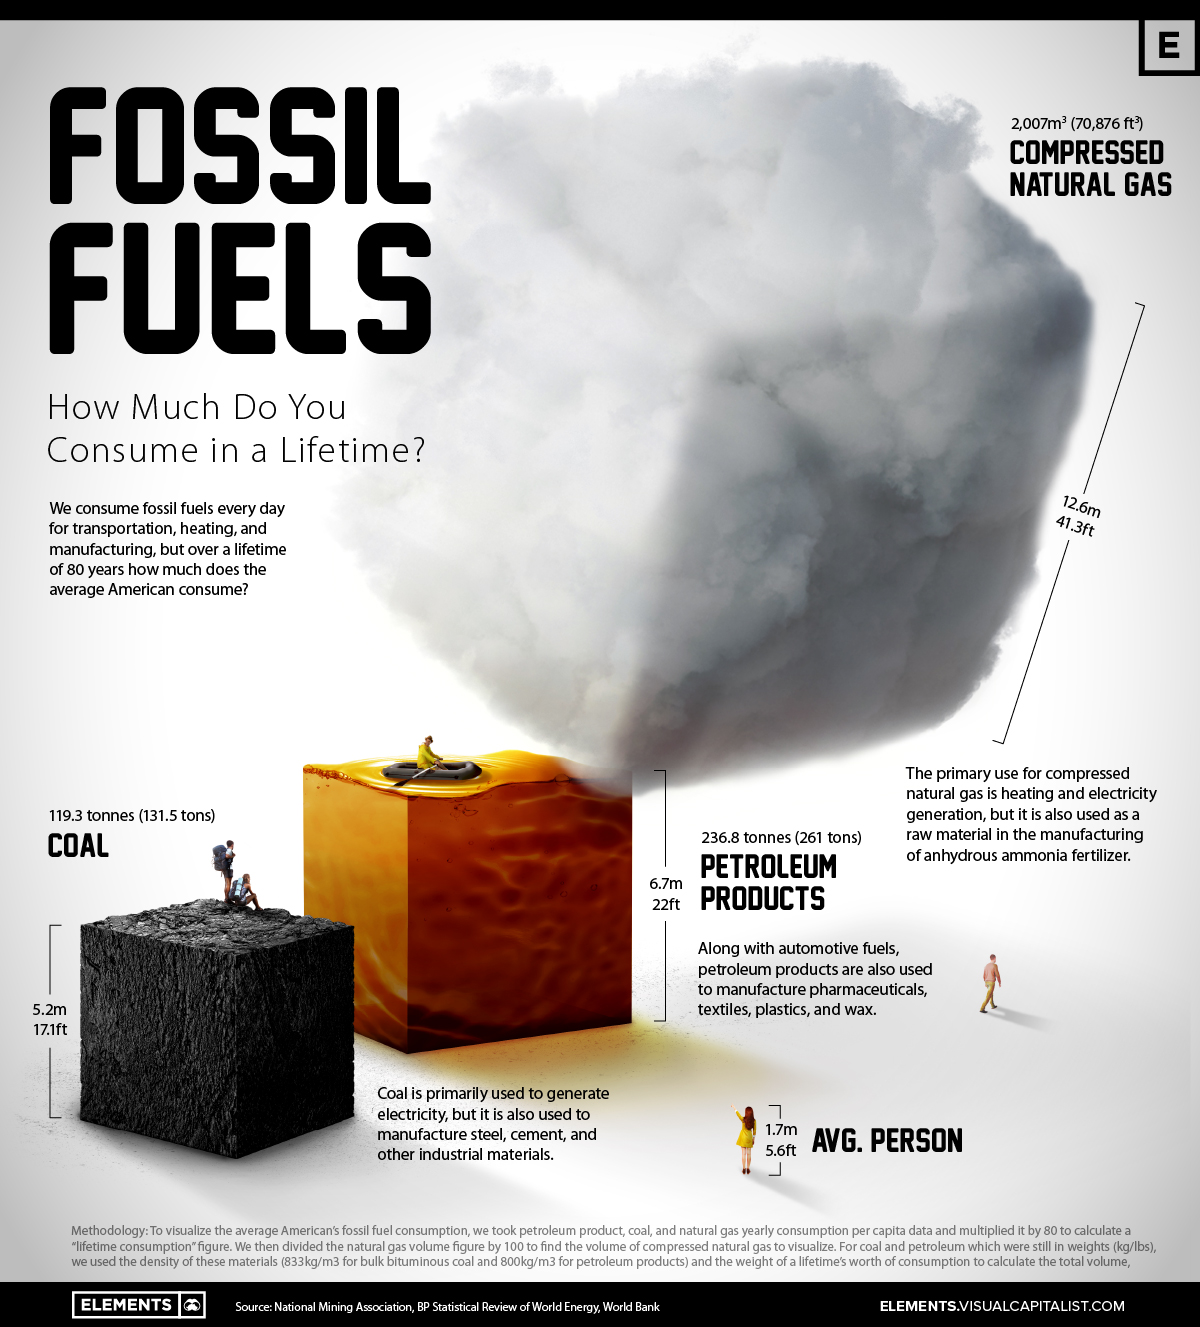
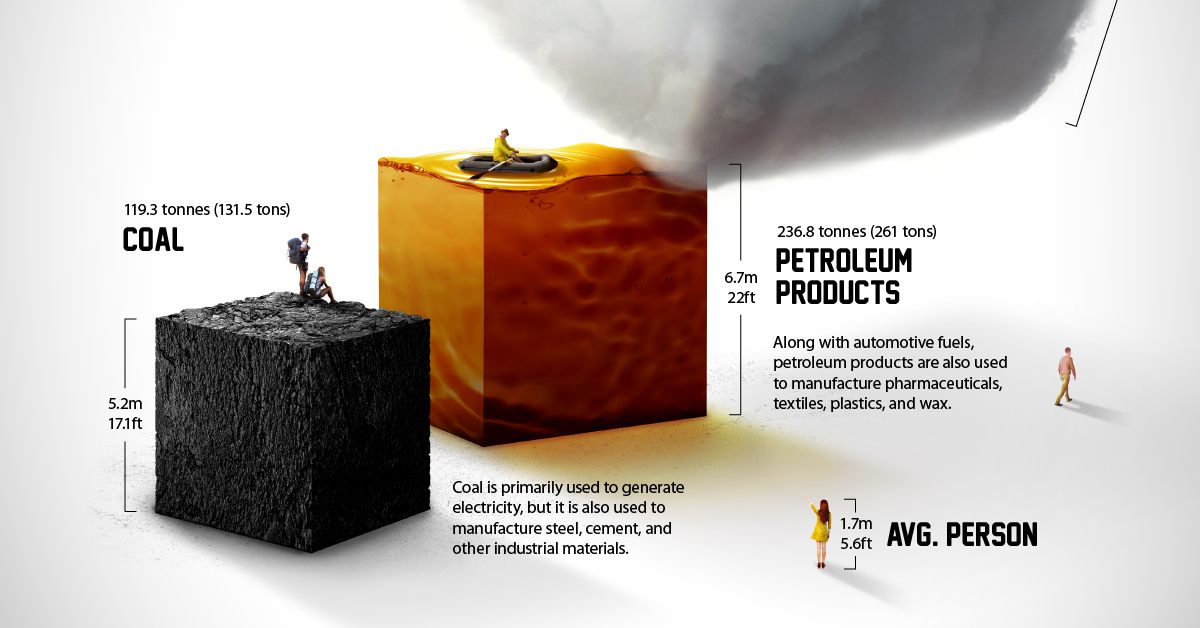
From burning natural gas to heat our homes to the petroleum-based materials found in everyday products like pharmaceuticals and plastics, we all consume fossil fuels in one form or another.
In 2021, the world consumed nearly 490 exajoules of fossil fuels, an unfathomable figure of epic proportions.
To put fossil fuel consumption into perspective on a more individual basis, this graphic visualizes the average person’s fossil fuel use over a lifetime of 80 years using data from the National Mining Association and BP’s Statistical Review of World Energy.
How Many Fossil Fuels a Person Consumes Every Year
On a day-to-day basis, our fossil fuel consumption might seem minimal, however, in just a year the average American consumes more than 23 barrels of petroleum products like gasoline, propane, or jet fuel.
The cube of the average individual’s yearly petroleum product consumption reaches around 1.5 meters (4.9 feet) tall. When you consider varying transportation choices and lifestyles, from public transit to private jets, the yearly cube of petroleum product consumption for some people may easily overtake their height.
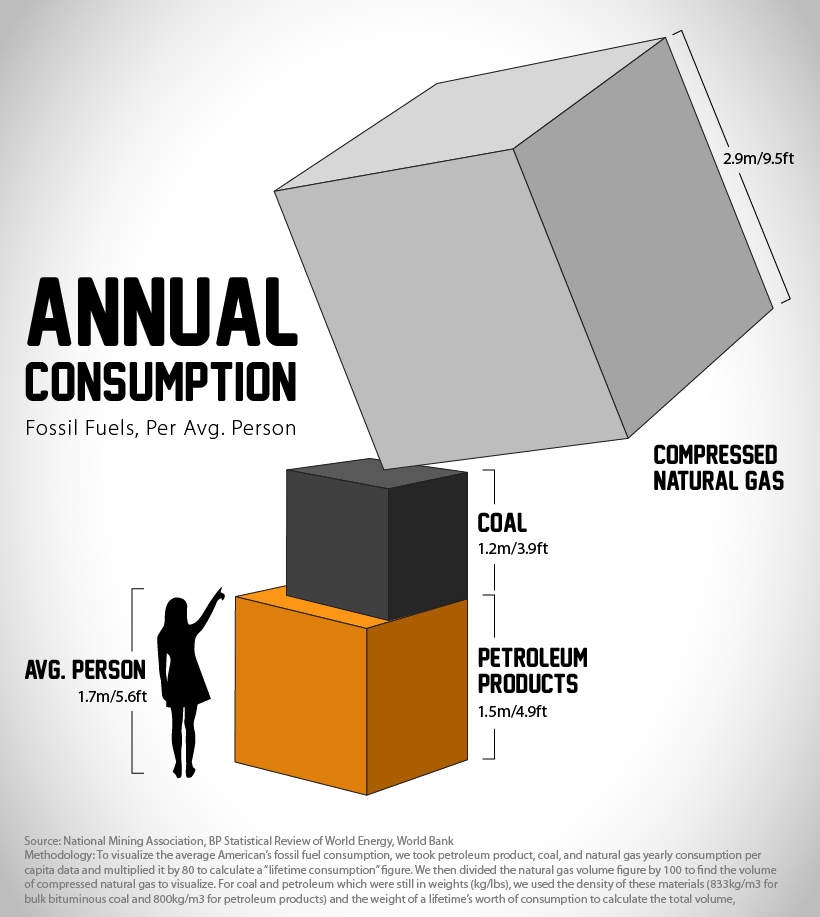
To calculate the volume needed to visualize the petroleum products and coal cubes (natural gas figures were already in volume format), we used the densities of bulk bituminous coal (833kg/m3) and petroleum products (800kg/m3) along with the weights of per capita consumption in the U.S. from the National Mining Association.
These figures are averages, and can differ per person depending on a region’s energy mix, transportation choices, and consumption habits, along with other factors.
Global Fossil Fuel Consumption Rebounds Post-Pandemic
When the global economy reopened post-pandemic, energy demand and consumption rebounded past 2019 levels with fossil fuels largely leading the way. While global primary energy demand grew 5.8% in 2021, coal consumption rose by 6% reaching highs not seen since 2014.
In 2021, renewables and hydroelectricity made up nearly 14% of the world’s primary energy use, with fossil fuels (oil, natural gas, and coal) accounting for 82% (down from 83% in 2020), and nuclear energy accounting for the remaining 4%.
Recent demand for fossil fuels has been underpinned by their reliability as generating energy from renewables in Germany has been inconsistent when it’s been needed most.
Now the country grapples with energy rations as it restarts coal-fired power plants in response to its overdependence on Russian fossil fuel energy as the potential permanence of the Nord Stream 1 natural gas pipeline shutdown looms.
Growing Green Energy Amidst Geopolitical Instability
Domestic energy and material supply chain independence quickly became a top priority for many nations amidst Russia’s invasion of Ukraine, Western trade sanctions, and increasingly unpredictable COVID-19 lockdowns in China.
Trade and energy dependence risks still remain a major concern as many nations transition towards renewable energy. For example, essential rare earth mineral production, and solar PV manufacturing supply chains remain dominated by China.
Despite looming storm clouds over global energy and materials trade, renewable energy’s green linings are growing on the global scale. The world’s renewable primary energy consumption reached an annual growth rate of 15%, outgrowing all other energy fuels as wind and solar provided a milestone 10% of global electricity in 2021.
If the global energy mix continues to get greener fast enough, the cubes of our personal fossil fuel consumption may manage to get smaller in the future.


Who’s Building the Most Solar Energy?
This was originally posted on our Voronoi app. Download the app for free on iOS or Android and discover incredible data-driven charts from a variety of trusted sources.
In 2023, solar energy accounted for three-quarters of renewable capacity additions worldwide. Most of this growth occurred in Asia, the EU, and the U.S., continuing a trend observed over the past decade.
In this graphic, we illustrate the rise in installed solar photovoltaic (PV) capacity in China, the EU, and the U.S. between 2010 and 2022, measured in gigawatts (GW). Bruegel compiled the data..
Chinese Dominance
As of 2022, China’s total installed capacity stands at 393 GW, nearly double that of the EU’s 205 GW and surpassing the USA’s total of 113 GW by more than threefold in absolute terms.
| Installed solar capacity (GW) | China | EU27 | U.S. |
|---|---|---|---|
| 2022 | 393.0 | 205.5 | 113.0 |
| 2021 | 307.0 | 162.7 | 95.4 |
| 2020 | 254.0 | 136.9 | 76.4 |
| 2019 | 205.0 | 120.1 | 61.6 |
| 2018 | 175.3 | 104.0 | 52.0 |
| 2017 | 130.8 | 96.2 | 43.8 |
| 2016 | 77.8 | 91.5 | 35.4 |
| 2015 | 43.6 | 87.7 | 24.2 |
| 2014 | 28.4 | 83.6 | 18.1 |
| 2013 | 17.8 | 79.7 | 13.3 |
| 2012 | 6.7 | 71.1 | 8.6 |
| 2011 | 3.1 | 53.3 | 5.6 |
| 2010 | 1.0 | 30.6 | 3.4 |
Since 2017, China has shown a compound annual growth rate (CAGR) of approximately 25% in installed PV capacity, while the USA has seen a CAGR of 21%, and the EU of 16%.
Additionally, China dominates the production of solar power components, currently controlling around 80% of the world’s solar panel supply chain.
In 2022, China’s solar industry employed 2.76 million individuals, with manufacturing roles representing approximately 1.8 million and the remaining 918,000 jobs in construction, installation, and operations and maintenance.
The EU industry employed 648,000 individuals, while the U.S. reached 264,000 jobs.
According to the IEA, China accounts for almost 60% of new renewable capacity expected to become operational globally by 2028.
Despite the phasing out of national subsidies in 2020 and 2021, deployment of solar PV in China is accelerating. The country is expected to reach its national 2030 target for wind and solar PV installations in 2024, six years ahead of schedule.

-

 Markets5 days ago
The World’s Fastest Growing Emerging Markets (2024-2029 Forecast)
-

 Technology2 weeks ago
All of the Grants Given by the U.S. CHIPS Act
-

 Green2 weeks ago
The Carbon Footprint of Major Travel Methods
-

 United States2 weeks ago
Visualizing the Most Common Pets in the U.S.
-

 Culture2 weeks ago
The World’s Top Media Franchises by All-Time Revenue
-

 Visual Capitalist1 week ago
Best Visualizations of April on the Voronoi App
-

 Wealth1 week ago
Charted: Which Country Has the Most Billionaires in 2024?
-

 Markets1 week ago
The Top Private Equity Firms by Country