Green
Chart: Is ESG Investing in Decline?
Subscribe to the Advisor Channel free mailing list for more like this
Is ESG Investing in Decline?
This was originally posted on Advisor Channel. Sign up to the free mailing list to get beautiful visualizations on financial markets that help advisors and their clients.
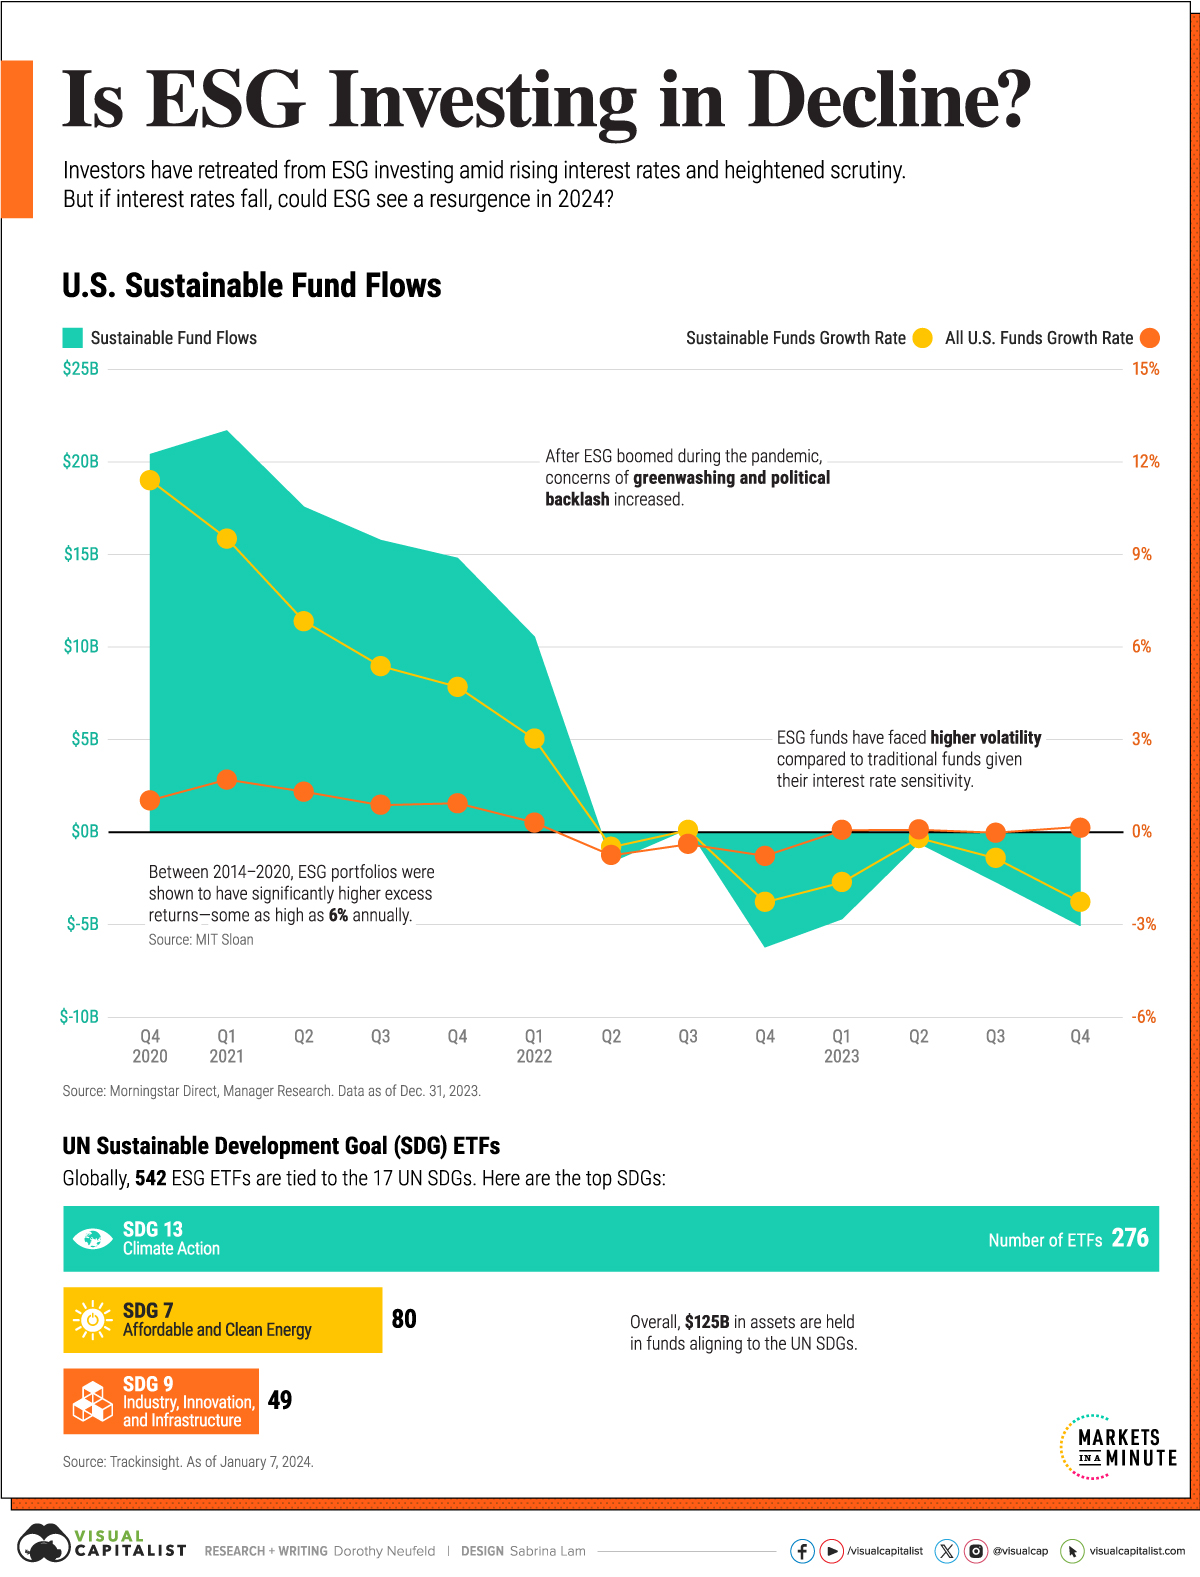
These days, ESG investments have lost their luster given high interest rates, political backlash, and greenwashing scrutiny.
In 2021 during the pandemic boom, U.S. sustainable funds hit a record $358 billion in assets, up from $95 billion in 2017. But since then, investor interest has waned as higher borrowing costs impact capital-intensive clean tech stocks.
This graphic shows the drop in sustainable fund flows—often considered an indicator of investor sentiment—based on data from Morningstar.
Slowing Demand
In 2023, investor appetite cooled for sustainable investments, as fund flows notched their worst year on record.
Overall, flows sank $13 billion as fund performance lagged behind conventional funds. Adding to this, concerns surrounding the murkiness of environmental, social, and governance (ESG) ratings were put under the spotlight.
As ESG pushback intensified in U.S. politics, at least 165 anti-ESG bills were introduced in 2023. Politicians have claimed that ESG criteria negatively impacts financial returns, but evidence behind that is mixed.
While sustainable funds underperformed traditional funds in 2023, a separate study showed that ESG portfolios had as much as 6% excess returns annually compared to benchmark indexes between 2014 and 2020.
ESG Investments: A Closer Look
One key aspect of ESG funds is whether they hold investments that align with the UN Sustainable Development Goals (SDGs).
Globally, 542 funds with $125 billion in assets are associated with at least one of these objectives. The table below shows the top five SDGs, by ETF assets under management (AUM).
| SDG | Goal | Number of ETFs | AUM |
|---|---|---|---|
| SDG 13 | Climate Action | 275 | $65.4B |
| SDG 7 | Affordable and Clean Energy | 80 | $15.3B |
| SDG 9 | Industry, Innovation, and Infrastructure | 49 | $13.4B |
| SDG 6 | Clean Water and Sanitation | 16 | $9.1B |
| SDG 11 | Sustainable Cities and Communities | 34 | $5.5B |
Source: Trackinsight. As of January 7, 2024.
We can see that Climate Action is the highest overall, with companies held in these ETFs making commitments to lower emissions and advance sustainability.
For instance, Home Depot has cut electricity use by over 50% since 2010 in U.S. stores, and aims to use renewables for all of its electricity by 2030. In addition, Microsoft has committed to this goal through a number of initiatives, including providing access to clean water to over one million people across Indonesia, Brazil, India, and Mexico in 2023.
While investor interest has slowed, 35% of advisors said they used ESG funds last year, based on a Journal of Financial Planning survey. As the industry matures, it remains to be seen if ESG investments will see a resurgence, especially if interest rates fall in the coming years.


Automotive
How People Get Around in America, Europe, and Asia
Examining how people get around using cars, public transit, and walking or biking, and the regional differences in usage.


How People Get Around in America, Europe, and Asia
This was originally posted on our Voronoi app. Download the app for free on iOS or Android and discover incredible data-driven charts from a variety of trusted sources.
This chart highlights the popularity of different transportation types in the Americas, Europe, and Asia, calculated by modal share.
Data for this article and visualization is sourced from ‘The ABC of Mobility’, a research paper by Rafael Prieto-Curiel (Complexity Science Hub) and Juan P. Ospina (EAFIT University), accessed through ScienceDirect.
The authors gathered their modal share data through travel surveys, which focused on the primary mode of transportation a person employs for each weekday trip. Information from 800 cities across 61 countries was collected for this study.
North American Car Culture Contrasts with the Rest of the World
In the U.S. and Canada, people heavily rely on cars to get around, no matter the size of the city. There are a few exceptions of course, such as New York, Toronto, and smaller college towns across the United States.
| Region | 🚗 Cars | 🚌 Public Transport | 🚶 Walking/Biking |
|---|---|---|---|
| North America* | 92% | 5% | 4% |
| Central America | 23% | 42% | 35% |
| South America | 29% | 40% | 31% |
| Northern Europe | 48% | 29% | 24% |
| Western Europe | 43% | 24% | 34% |
| Southern Europe | 50% | 24% | 25% |
| Eastern Europe | 35% | 40% | 25% |
| Southeastern Asia | 44% | 43% | 13% |
| Western Asia | 43% | 28% | 29% |
| Southern Asia | 22% | 39% | 39% |
| Eastern Asia | 19% | 46% | 35% |
| World | 51% | 26% | 22% |
Note: *Excluding Mexico. Percentages are rounded.
As a result, North America’s share of public transport and active mobility (walking and biking) is the lowest amongst all surveyed regions by a significant amount.
On the other hand, public transport reigns supreme in South and Central America as well as Southern and Eastern Asia. It ties with cars in Southeastern Asia, and is eclipsed by cars in Western Asia.
As outlined in the paper, Europe sees more city-level differences in transport popularity.
For example, Utrecht, Netherlands prefers walking and biking. People in Paris and London like using their extensive transit systems. And in Manchester and Rome, roughly two out of three journeys are by car.

-

 Healthcare4 days ago
What Causes Preventable Child Deaths?
-

 Best of2 weeks ago
Best Visualizations of April on the Voronoi App
-

 Wealth2 weeks ago
Charted: Which Country Has the Most Billionaires in 2024?
-

 Markets2 weeks ago
The Top Private Equity Firms by Country
-

 Jobs1 week ago
The Best U.S. Companies to Work for According to LinkedIn
-

 Economy1 week ago
Ranked: The Top 20 Countries in Debt to China
-

 Misc1 week ago
Charted: Trust in Government Institutions by G7 Countries
-

 Energy1 week ago
Mapped: The Age of Energy Projects in Interconnection Queues, by State