Technology
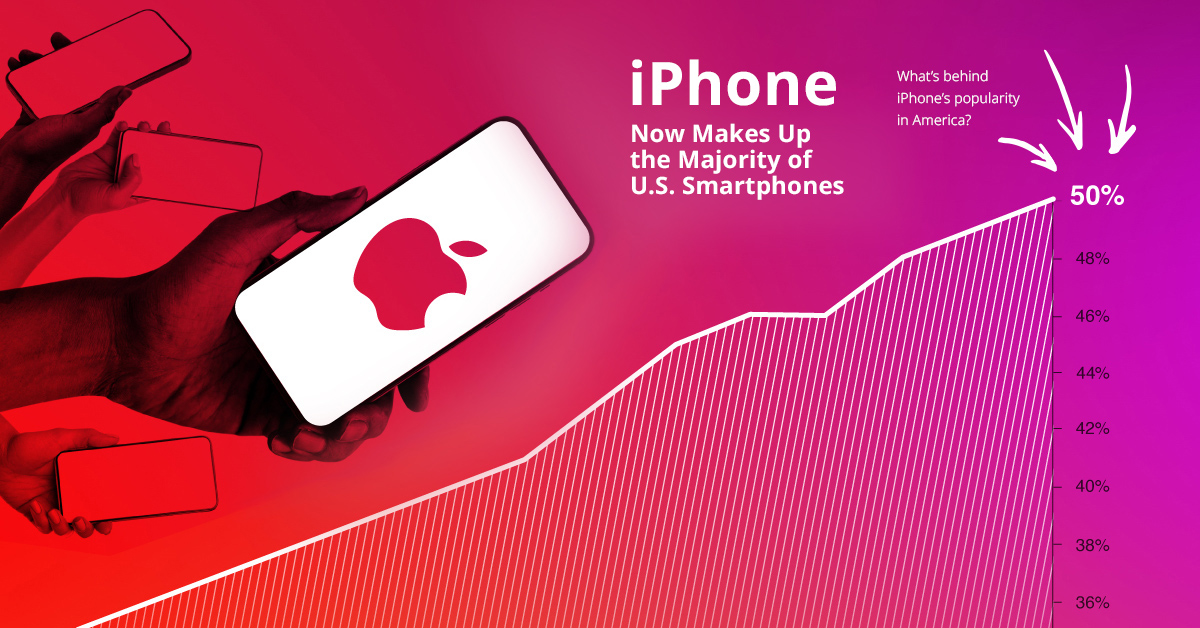
iPhone Now Makes Up the Majority of U.S. Smartphones


iPhone Now Makes Up the Majority of U.S. Smartphones
One of the most iconic tech moments of the 21st century is Steve Jobs, in his signature black turtleneck, holding up a small device: the iPhone. Since that introduction at the 2007 Macworld conference in San Francisco, iPhone has gone on to become a global phenomenon, with over 1.2 billion units now sold around the world.
Today, the smartphone market is a fiercely competitive space.
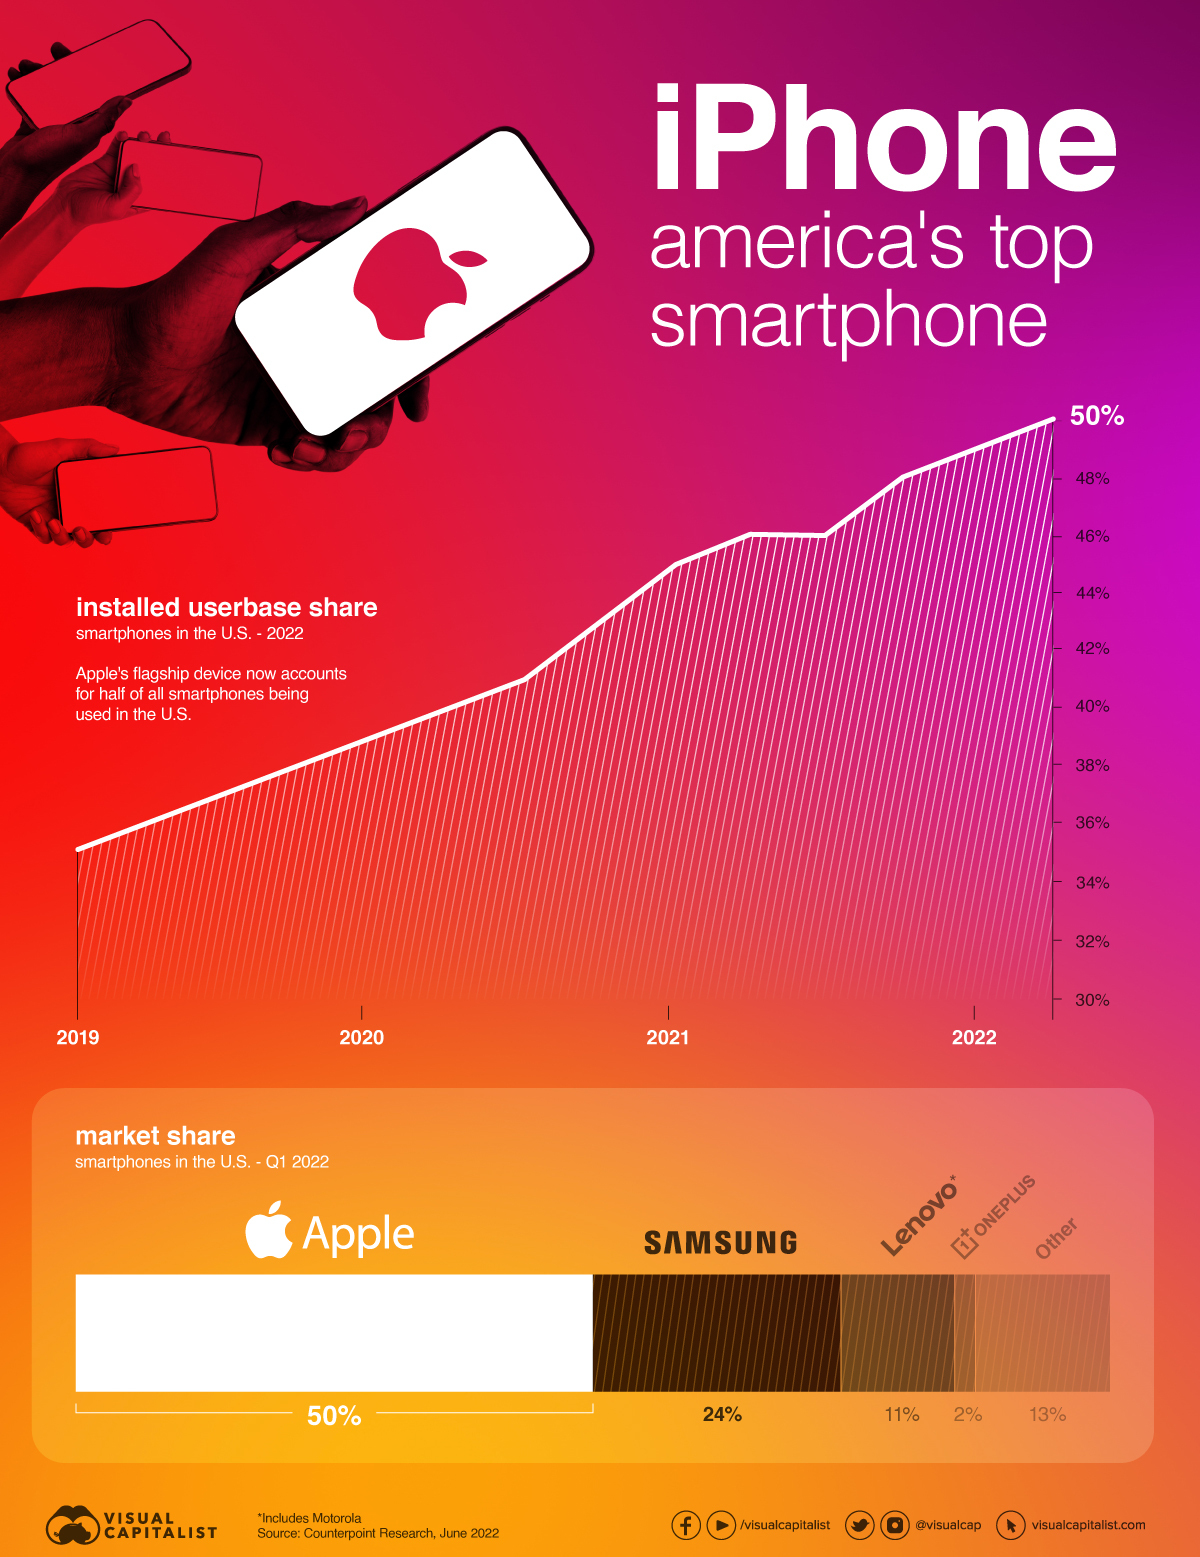
On a global scale, iPhone has carved out a respectable 16% of the smartphone market. In the U.S., however, the iPhone has managed to win the hearts and minds of more consumers. New data from Counterpoint Research via FT notes that iPhones now make up 50% of the overall installed user base* in the United States.
With a plethora of smartphone brands available to American consumers—and many at lower price points—what is it that makes this brand so popular?
iPhone: The Apple of America’s Eye
Experts point to a number of reasons why Apple’s flagship device outperforms in the U.S. compared to other markets.
- Apple has the highest brand loyalty of any major smartphone maker. 9 in 10 U.S. iPhone users plan to purchase an iPhone as their next device.
- iPhones appear to depreciate at a slower rate than other devices
- Broadly speaking, consumers in the U.S. have less price sensitivity than consumers in many other countries.
- Apple has been vocal in their messaging about protecting user privacy and data, and that message appears to be resonating with consumers.
This last point is worth digging into in more detail.
Winning the Privacy War
Personal data protection and cybersecurity have become mainstream concerns in recent years, and Apple has made security a priority.
Of course, security breaches can and do occur, regardless of what device is being used. That said, a recent survey by Beyond Identity indicates that iPhone users were less likely to be victims of security breaches, and were more likely to recover data in the event of a breach.
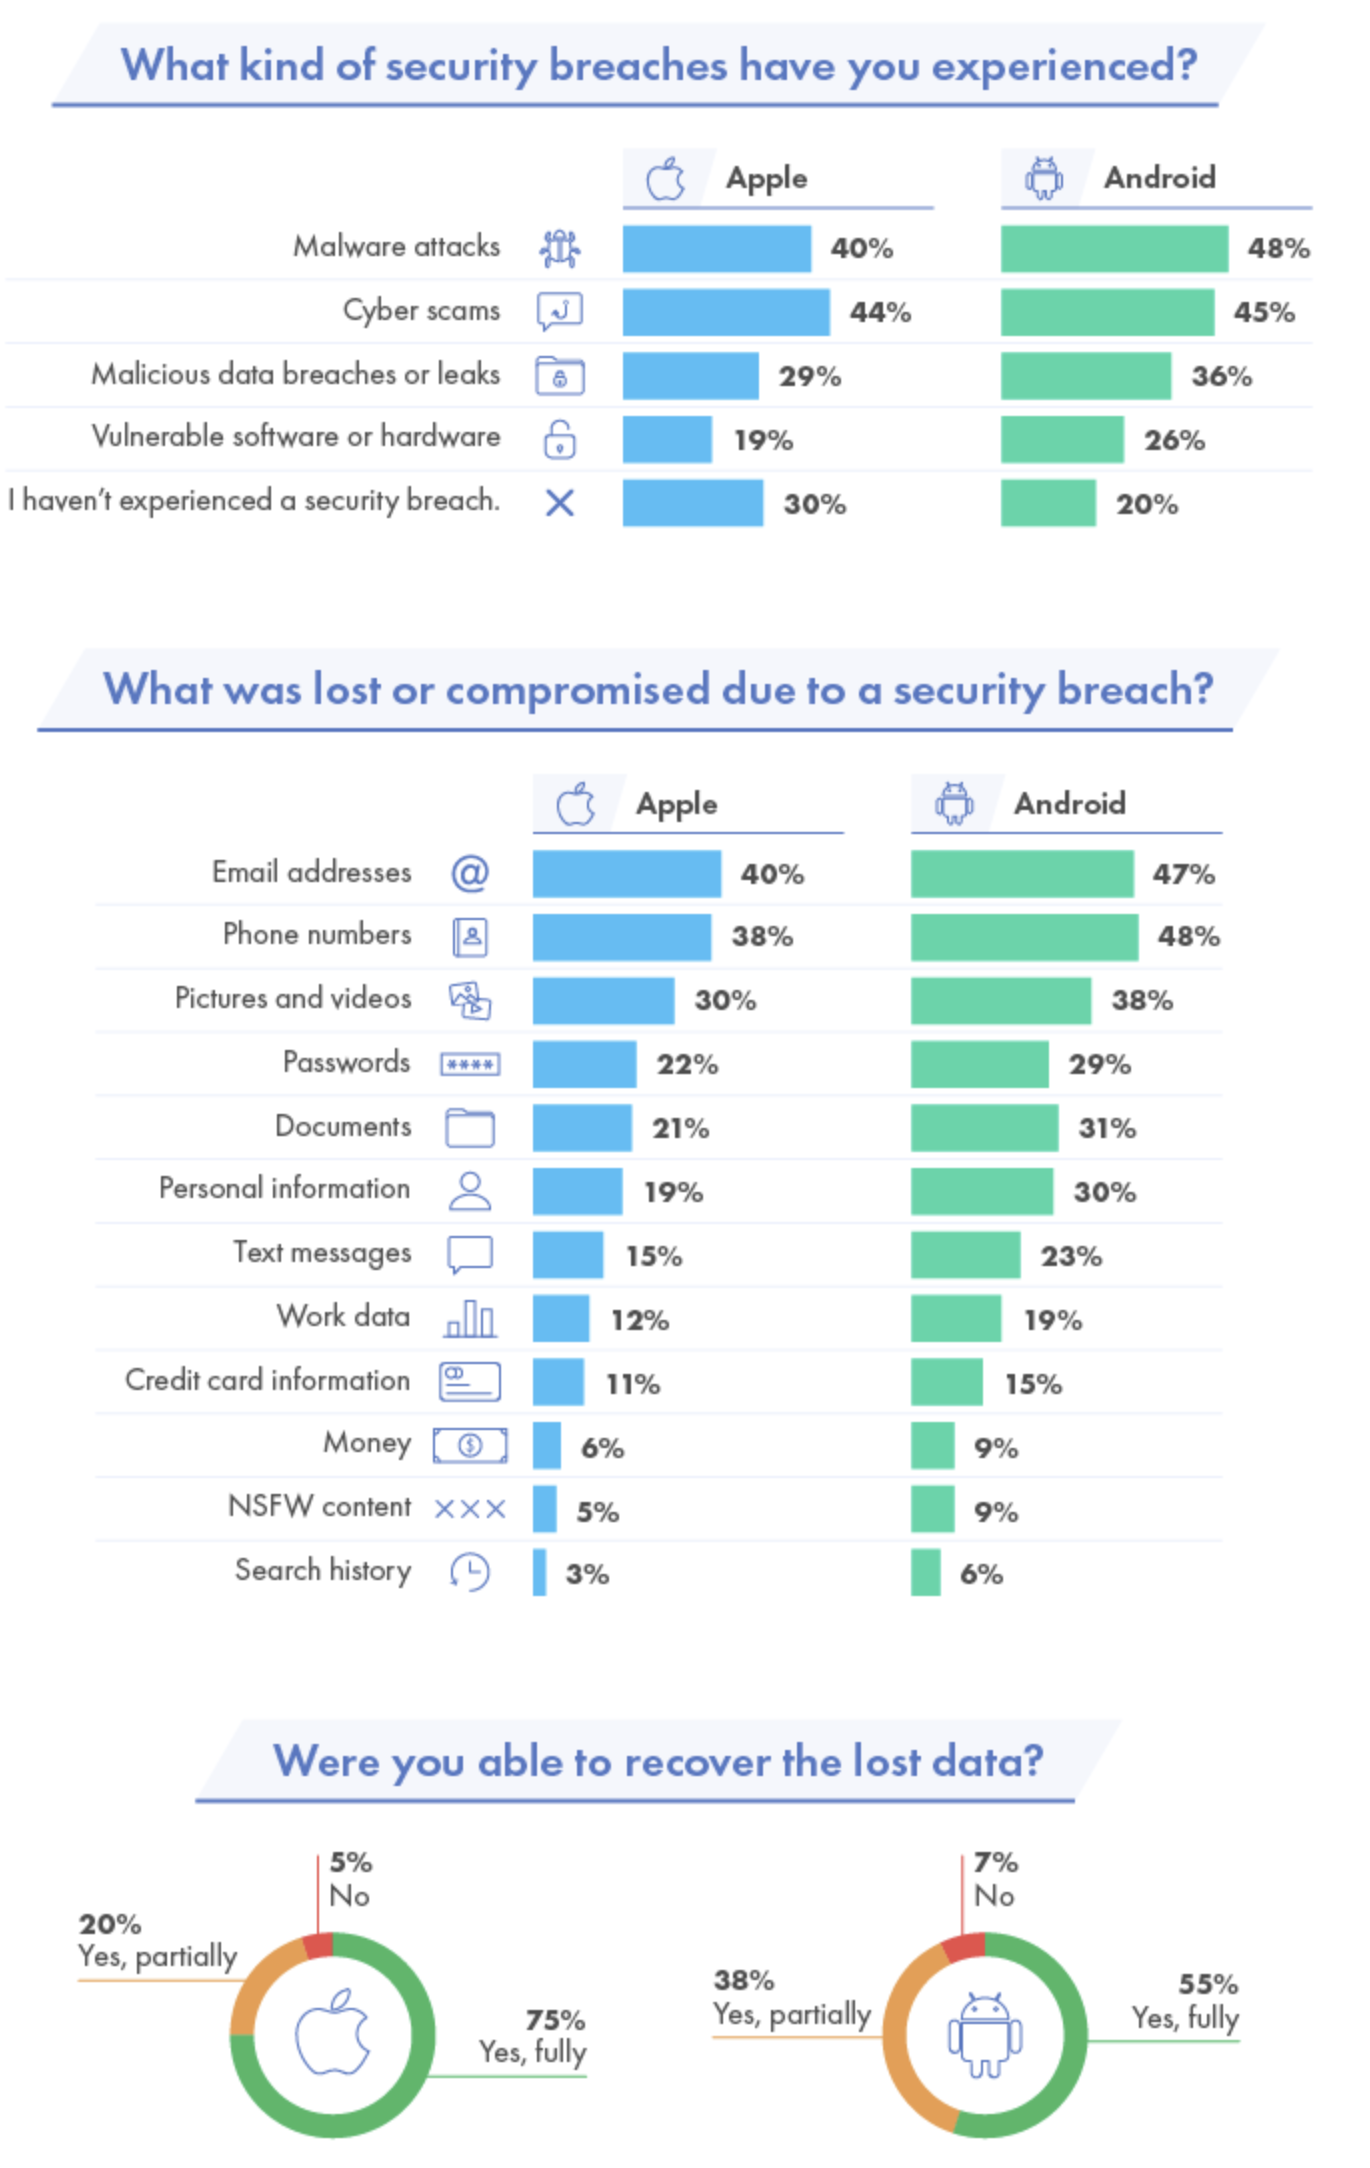
The survey also points out that iPhone users were less likely to have sensitive data, such as images and videos, credit card information, passwords, and personal data compromised when breaches occurred.
These findings aside, Apple has also been bullish on branding its devices as safe and secure. The “Privacy. That’s iPhone.” campaign launched in 2019, and most recently, Apple has put the data broker industry in its crosshairs through a new series of ad spots.
Simply put: whether or not iPhone is more secure than other devices, Apple has used its marketing muscle to sway public opinion at a time when Americans are focused on privacy. And based on these latest installed user base numbers, that strategy appears to be paying off.


Technology
Visualizing AI Patents by Country
See which countries have been granted the most AI patents each year, from 2012 to 2022.


Visualizing AI Patents by Country
This was originally posted on our Voronoi app. Download the app for free on iOS or Android and discover incredible data-driven charts from a variety of trusted sources.
This infographic shows the number of AI-related patents granted each year from 2010 to 2022 (latest data available). These figures come from the Center for Security and Emerging Technology (CSET), accessed via Stanford University’s 2024 AI Index Report.
From this data, we can see that China first overtook the U.S. in 2013. Since then, the country has seen enormous growth in the number of AI patents granted each year.
| Year | China | EU and UK | U.S. | RoW | Global Total |
|---|---|---|---|---|---|
| 2010 | 307 | 137 | 984 | 571 | 1,999 |
| 2011 | 516 | 129 | 980 | 581 | 2,206 |
| 2012 | 926 | 112 | 950 | 660 | 2,648 |
| 2013 | 1,035 | 91 | 970 | 627 | 2,723 |
| 2014 | 1,278 | 97 | 1,078 | 667 | 3,120 |
| 2015 | 1,721 | 110 | 1,135 | 539 | 3,505 |
| 2016 | 1,621 | 128 | 1,298 | 714 | 3,761 |
| 2017 | 2,428 | 144 | 1,489 | 1,075 | 5,136 |
| 2018 | 4,741 | 155 | 1,674 | 1,574 | 8,144 |
| 2019 | 9,530 | 322 | 3,211 | 2,720 | 15,783 |
| 2020 | 13,071 | 406 | 5,441 | 4,455 | 23,373 |
| 2021 | 21,907 | 623 | 8,219 | 7,519 | 38,268 |
| 2022 | 35,315 | 1,173 | 12,077 | 13,699 | 62,264 |
In 2022, China was granted more patents than every other country combined.
While this suggests that the country is very active in researching the field of artificial intelligence, it doesn’t necessarily mean that China is the farthest in terms of capability.
Key Facts About AI Patents
According to CSET, AI patents relate to mathematical relationships and algorithms, which are considered abstract ideas under patent law. They can also have different meaning, depending on where they are filed.
In the U.S., AI patenting is concentrated amongst large companies including IBM, Microsoft, and Google. On the other hand, AI patenting in China is more distributed across government organizations, universities, and tech firms (e.g. Tencent).
In terms of focus area, China’s patents are typically related to computer vision, a field of AI that enables computers and systems to interpret visual data and inputs. Meanwhile America’s efforts are more evenly distributed across research fields.
Learn More About AI From Visual Capitalist
If you want to see more data visualizations on artificial intelligence, check out this graphic that shows which job departments will be impacted by AI the most.

-

 Mining1 week ago
Gold vs. S&P 500: Which Has Grown More Over Five Years?
-

 Markets2 weeks ago
Ranked: The Most Valuable Housing Markets in America
-

 Money2 weeks ago
Which States Have the Highest Minimum Wage in America?
-

 AI2 weeks ago
Ranked: Semiconductor Companies by Industry Revenue Share
-

 Markets2 weeks ago
Ranked: The World’s Top Flight Routes, by Revenue
-

 Countries2 weeks ago
Population Projections: The World’s 6 Largest Countries in 2075
-

 Markets2 weeks ago
The Top 10 States by Real GDP Growth in 2023
-

 Demographics2 weeks ago
The Smallest Gender Wage Gaps in OECD Countries