Energy
All Electric Semi Truck Models in One Graphic
![]() Subscribe to the Elements free mailing list for more like this
Subscribe to the Elements free mailing list for more like this
Every Electric Semi Truck in One Graphic
This was originally posted on Elements. Sign up to the free mailing list to get beautiful visualizations on natural resource megatrends in your email every week.
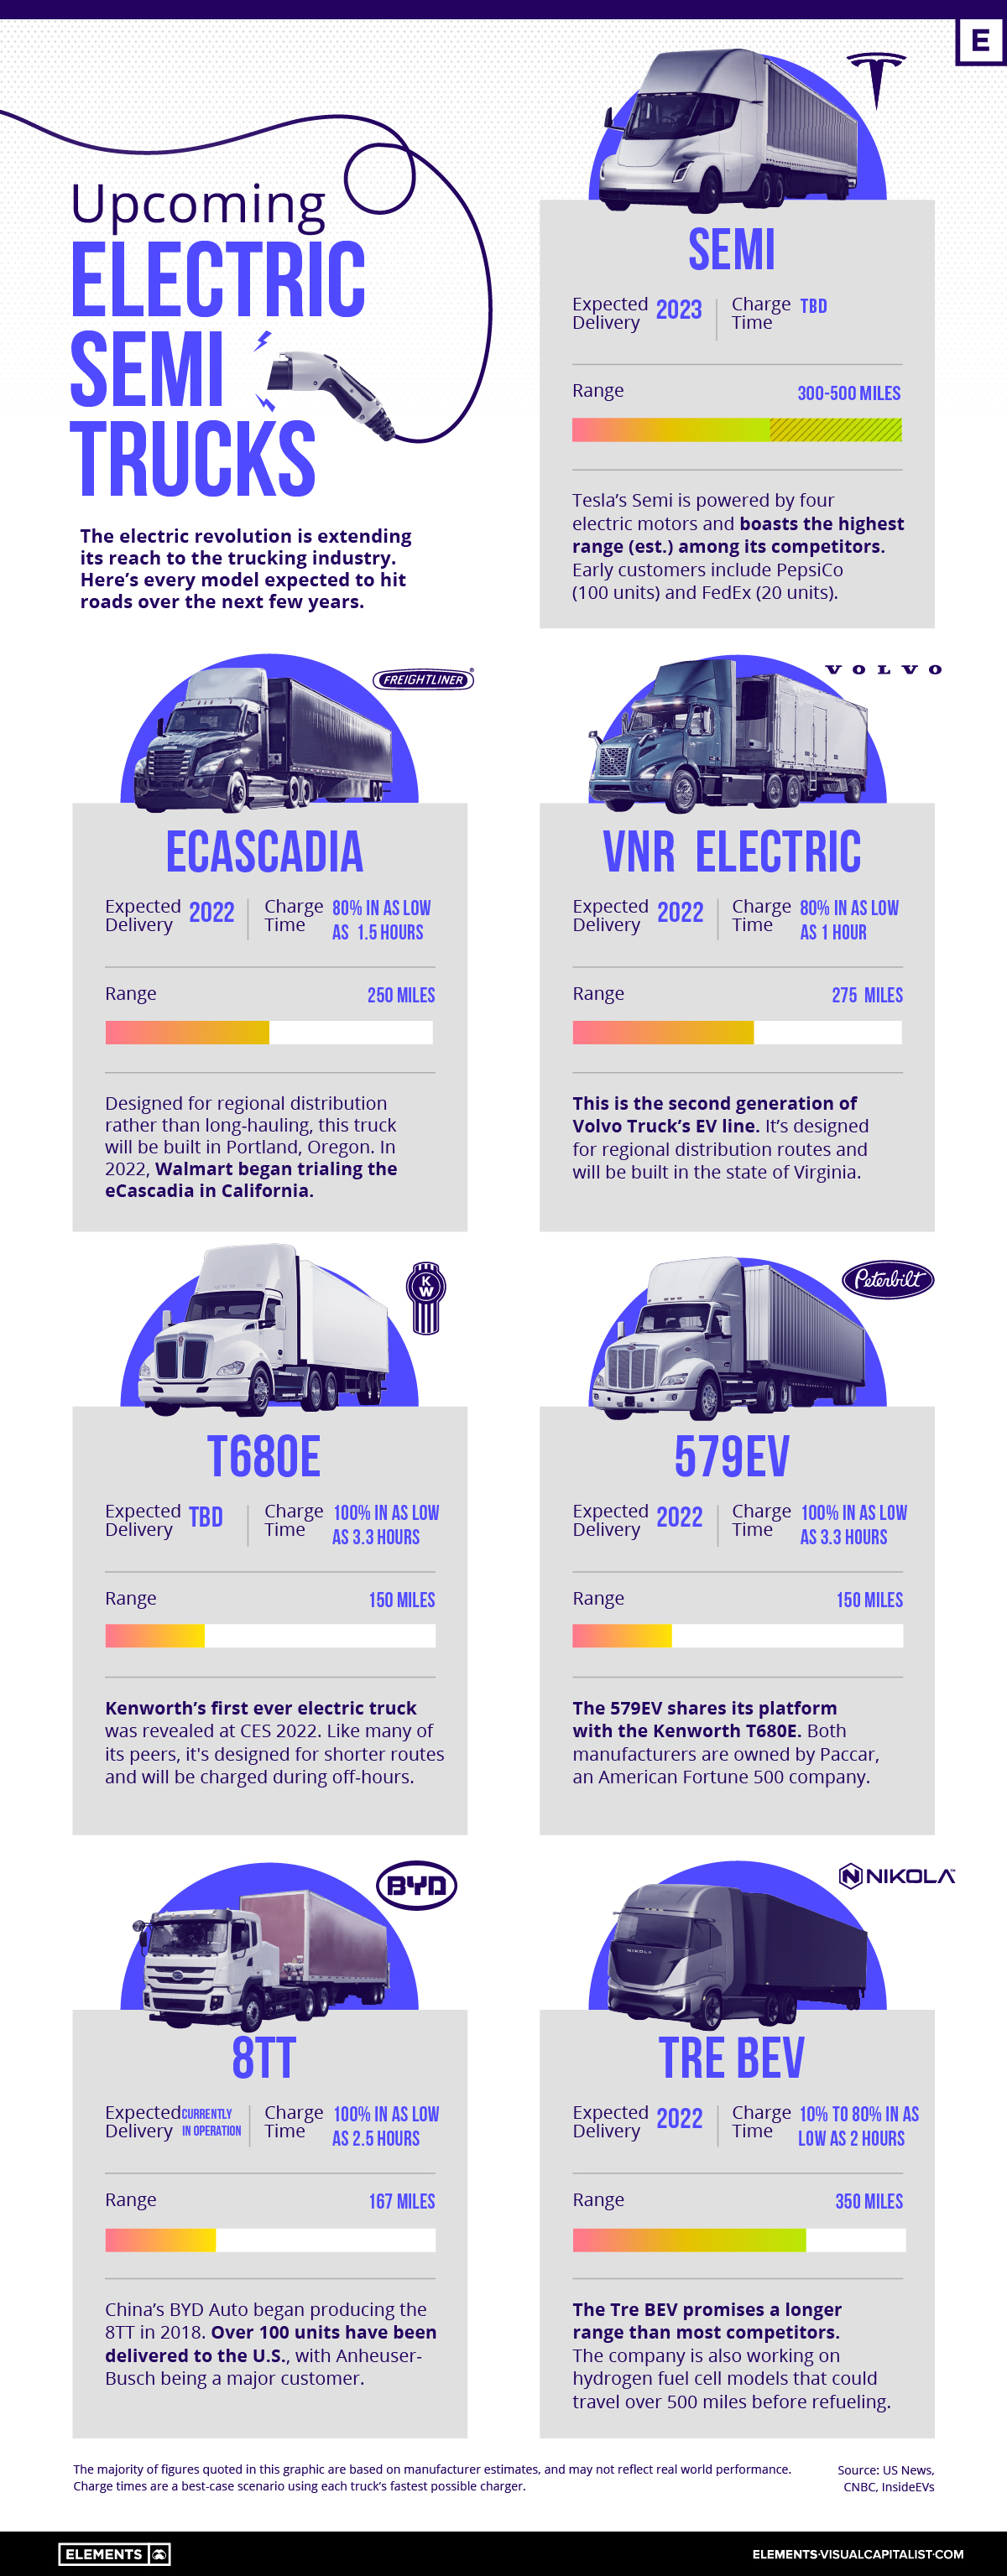
Electric semi trucks are coming, and they could help to decarbonize the shipping and logistics industry. However, range remains a major limitation.
This presents challenges for long-hauling, where the average diesel-powered semi can travel up to 2,000 miles before refueling. Compare this to the longest range electric model, the Tesla Semi, which promises up to 500 miles. A key word here is “promises”—the Semi is still in development, and nothing has been proven yet.
In this infographic, we’ve listed all of the upcoming electric semi trucks, complete with range and charge time estimates. Further in the article, we’ll explore the potential commercial use cases of this first generation of trucks.
Model Overview
The following table includes all of the models included in the above infographic.
| Company | Truck Name | Range | Charge Time | Expected Delivery |
|---|---|---|---|---|
| 🇺🇸 Tesla | Semi | 300-500 miles | TBD | 2023 |
| 🇺🇸 Freightliner | eCascadia | 250 miles | 80% in as low as 1.5 hrs | 2022 |
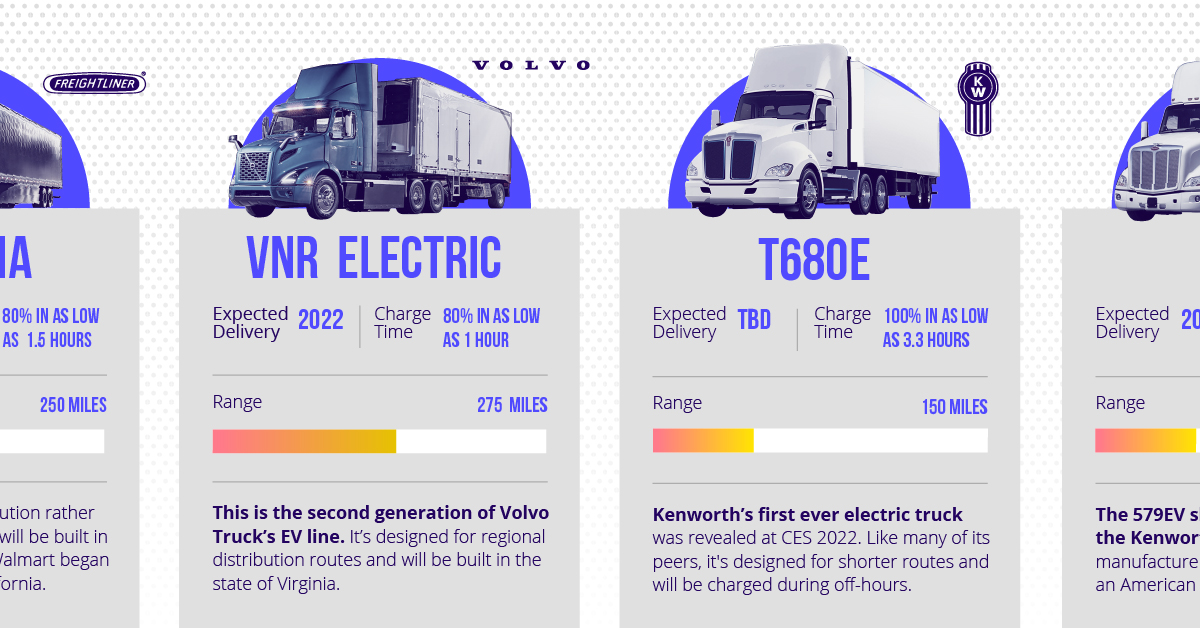
| 🇸🇪 Volvo | VNR Electric | 275 miles | 80% in as low as 1 hr | 2022 |
| 🇺🇸 Kenworth | T680E | 150 miles | 100% in as low as 3.3 hrs | TBD |
| 🇺🇸 Peterbilt | 579EV | 150 miles | 100% in as low as 3.3 hrs | 2022 |
| 🇨🇳 BYD | 8TT | 167 miles | 100% in as low as 2.5 hrs | In operation |
| 🇺🇸 Nikola | Tre BEV | 350 miles | 10% to 80% in as low as 2 hrs | 2022 |
Source: US News, CNBC, InsideEVs
With the exception of Tesla’s Semi, all of these trucks are currently in operation or expected to begin delivering this year. You may want to take this with a grain of salt, as the electric vehicle industry has become notorious for delays.
In terms of range, Tesla and Nikola are promising the highest figures (300+ miles), while the rest of the competition is targeting between 150 to 275 miles. It’s reasonable to assume that the Tesla and Nikola semis will be the most expensive.
Charge times are difficult to compare because of the variables involved. This includes the amount of charge and the type of charger used. Nikola, for example, claims it will take 2 hours to charge its Tre BEV from 10% to 80% when using a 240kW charger.
Charger technology is also improving quickly. Tesla is believed to be rolling out a 1 MW (1,000 kW) charger that could add 400 miles of range in just 30 minutes.
Use Cases of Electric Semi Trucks
Given their relatively lower ranges, electric semis are unlikely to be used for long hauls.
Instead, they’re expected to be deployed on regional and urban routes, where the total distance traveled between destinations is much lower. There are many reasons why electric semis are suited for these routes, as listed below:
- Smaller batteries can be installed, which keeps the cost of the truck lower
- Urban routes provide greater opportunities to use regenerative braking
- Quieter and cleaner operation in densely populated areas
An example of a regional route would be delivering containers from the Port of Los Angeles to the Los Angeles Transportation Center Intermodal Facility (LATC). The LATC is where containers are loaded onto trains, and is located roughly 28 miles away.
With a round trip totaling nearly 60 miles, an electric semi with a range of 200 miles could feasibly complete this route three times before needing a charge. The truck could be charged overnight, as well as during off hours in the middle of the day.
Hydrogen for Long Hauls?
We’ve covered the differences between battery and hydrogen fuel cell vehicles in the past, but this was from a passenger car perspective. The conclusion, in that case, was that battery electric has become the dominant technology. In terms of long-haul trucking, however, hydrogen may have an edge.
If we look at what will become mainstream, probably for smaller mobility it will be EVs, and fuel cells for larger mobility. That is the conclusion so far.
-Toshihiro Mibe, CEO, Honda
There are several reasons for why hydrogen could be beneficial for delivering heavy cargo over long distances. These are listed below:
- Refueling a hydrogen fuel cell takes less time than recharging a battery. Note, however, that charge times are still improving.
- A fuel cell configuration is typically lighter than an equivalent battery pack. Less drivetrain weight translates to a higher cargo capacity.
- Hydrogen-powered trucks could achieve a much higher range.
This last point hasn’t been proven yet, but we can reference Nikola, which is developing hydrogen-powered semi trucks. The company has two models in the works, which are the Tre FCEV with a range of 500 miles, and the Two FCEV with a range of 900 miles.
Keep in mind that these numbers are once again estimates and that Nikola has been accused of fraud in the past.
Who’s Using Electric Semi Trucks Today?
Although there are very few models available, electric semi trucks are indeed being used today.
In January 2020, Anheuser-Busch announced that it had received its 100th 8TT. The 8TT is produced by China’s BYD Motors and was one of the first electric semis to see real-world application. The brewing company uses its 8TTs to deliver products to retail destinations across California (e.g. grocery stores).
Another U.S. company using electric semis is Walmart. The retailer is trialing both the eCascadia from Freightliner and the Tre BEV from Nikola. The trucks are being used to pick up cargo from suppliers and then deliver it to regional consolidation centers.
Energy
Mapped: The Age of Energy Projects in Interconnection Queues, by State
This map shows how many energy projects are in interconnection queues by state and how long these projects have been queued up, on average.


Age of Energy Projects in Interconnection Queues, by State
This was originally posted on our Voronoi app. Download the app for free on iOS or Android and discover incredible data-driven charts from a variety of trusted sources.
By the end of 2023, more than 11,000 energy projects were in interconnection queues in the United States, waiting for a green-light from regional grid operators to proceed with construction.
This map, created in partnership with the National Public Utilities Council, maps out the average age of active energy projects in interconnection queues by state, using data from Berkeley Lab.
Interconnection Queues, Explained
Interconnection queues are lists of energy projects that have made interconnection requests to their regional grid operators. Once submitted, these requests formally initiate the impact study process that each project goes through before grid connection, forming waiting lists for approval known as interconnection queues.
In recent years, both the number and generation capacity of queued projects have surged in the United States, along with the length of time spent in queue.
According to Berkeley Lab, the amount of generation capacity entering queues each year has risen by more than 550% from 2015 to 2023, with average queue duration rising from 3 years to 5 years the same period.
As a result of the growing backlog, a large proportion of projects ultimately withdraw from queues, leading to only 19% of applications reaching commercial operations.
The Backlog: Number of Projects and Average Wait Times
Of the 11,000 active projects in U.S. queues at the end of 2023, Texas, California, and Virginia had the most in queue; 1,208, 947, and 743, respectively.
When looking at the average ages of these projects, all three states hovered around the national average of 34 months (2.83 years), with Texas sporting 28 months, California 33, and Virginia 34.
Vermont, Minnesota, Wisconsin, and Florida, on the other hand, had the highest average queue durations; 54, 49, 47, and 46 months, respectively.
Average Queue Duration by Project Type
At the end of 2023, more than 95% of the generation capacity in active interconnection queues was for emission-free resources. The table below provides a breakdown.
| Project Type | Average Queue Duration (As of 12/31/2023) | Number of Projects in Queue |
|---|---|---|
| Wind | 40 months | 841 |
| Solar | 34 months | 4,506 |
| Wind+Battery | 34 months | 76 |
| Solar+Battery | 27 months | 2,377 |
| Battery | 24 months | 2,818 |
Wind projects had the highest wait times at the end of 2023 with an average age of 40 months (3.33 years). Solar projects, on the other hand, made up more than 40% of projects in queue.
Overall, reducing the time that these renewable energy projects spend in queues can accelerate the transition to a low-carbon energy future.
According to the U.S. Department of Energy, enhancing data transparency, streamlining approval processes, promoting economic efficiency, and maintaining a reliable grid are some of the ways this growing backlog can be mitigated.

-

 Best of6 days ago
Best Visualizations of April on the Voronoi App
-

 Brands2 weeks ago
How Tech Logos Have Evolved Over Time
-

 Energy2 weeks ago
Ranked: The Top 10 EV Battery Manufacturers in 2023
-

 Demographics2 weeks ago
Countries With the Largest Happiness Gains Since 2010
-

 VC+2 weeks ago
VC+: Get Our Key Takeaways From the IMF’s World Economic Outlook
-

 Demographics2 weeks ago
The Countries That Have Become Sadder Since 2010
-

 Money2 weeks ago
Charted: Who Has Savings in This Economy?
-

 Technology1 week ago
Visualizing AI Patents by Country