Technology
Charted: The Rise of Mobile Device Subscriptions Worldwide
Article/Editing:
Charting The Rise of Mobile Device Subscriptions Worldwide
There were approximately 8.6 billion mobile device subscriptions worldwide as of 2021, more than there are people on the planet.
Yet, while mobile phones, tablets, and other devices have become extremely common across the globe, access still varies greatly from country to country.
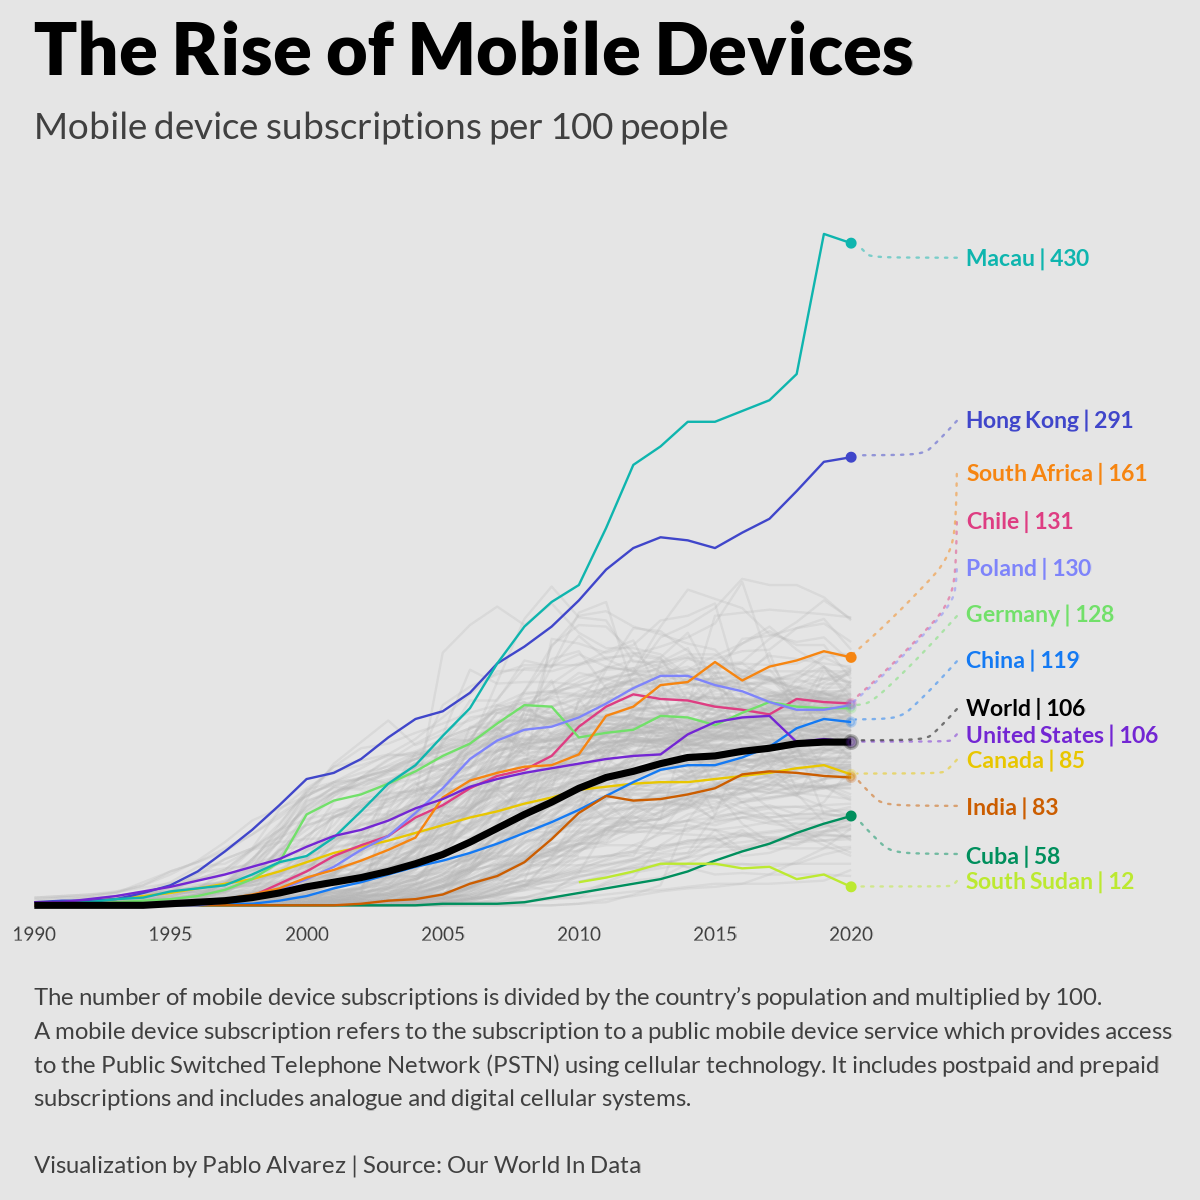
Using data from Our World in Data, this chart by Pablo Alvarez tracks the rise of mobile phones across the globe, showing the discrepancies in mobile phone subscriptions in select countries.
The Evolution of the Mobile Market
Before diving into the present-day divide, it’s worth quickly explaining how the overall cell phone market and mobile devices in general have evolved over the last three decades.
Below is a summary of the history of the mobile market since its onset in the early 90s.
The 90s and Early 2000s: The Beginning
The first mobile device hit the market in 1983, with Motorola’s launch of the DynaTAC 8000X. This clunky analog phone cost nearly $4,000 and needed to be recharged after 30 minutes of use.
By the early 1990s, innovation in the industry had somewhat taken off, with various manufacturers like Nokia and Sony starting to launch their own devices.
While this gave consumers more product options to choose from, the technology was still fairly new, and mobile adoption was relatively low compared to today’s figures.
2007 and Onwards: Apple Opens Up the Market
Though many companies introduced mobile phones, and a few launched early tablet devices like the PalmPilot and the Nokia 770, it was Apple’s foray into the market that shook things up.
The iPhone’s launch in 2007, and the iPad’s debut in 2010, ushered in a new era of mobile devices. Their touch-screen design was revolutionary at the time, and they were also exceptionally more functional through the App Store, since users could download hundreds of different mobile applications and games quickly.
This is when the rise of mobile really started to pick up across the globe. In 2007, there were nearly 3.4 billion mobile device subscriptions worldwide or about 50% of the global population.
Present Day: Mobile Devices Are Common, But Not Ubiquitous
In many parts of the world, millions of people rely on their mobile phones and tablets every day for work, social life, or simple day-to-day activities like figuring out directions or deciding what to make for dinner.
Yet, while overall mobile subscriptions have surpassed the global population, adoption hasn’t been equally spread across the globe.
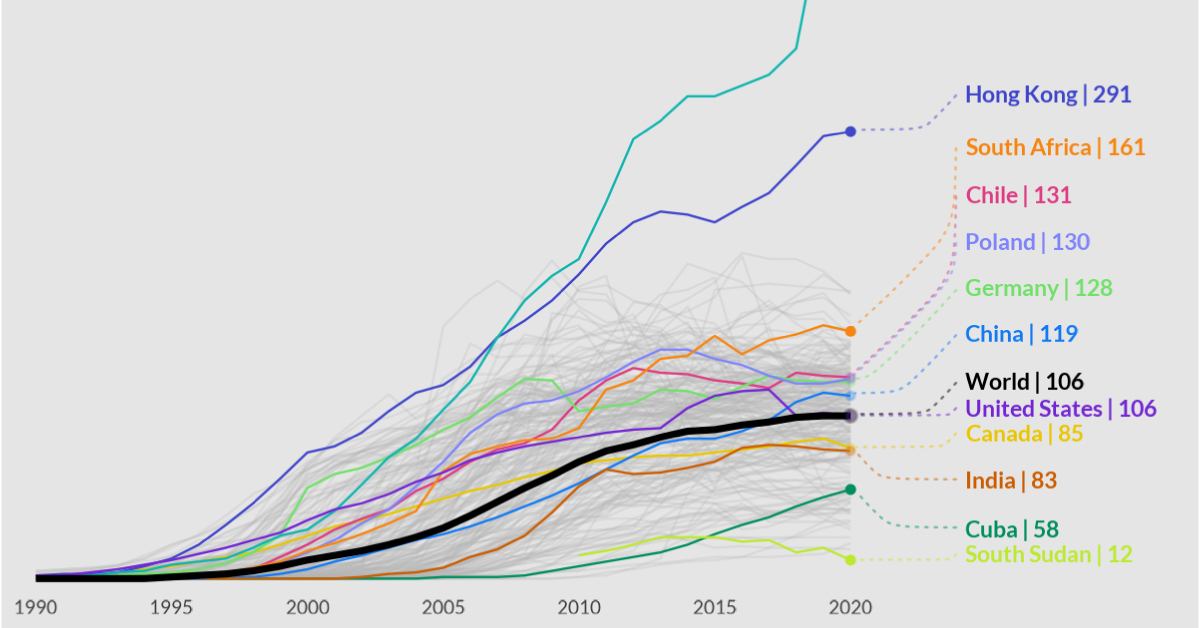
Here’s a look at mobile device subscriptions per 100 people, in 12 different regions:
| Country | Mobile Subscriptions Per 100 People (2020) |
|---|---|
| 🇲🇴 Macau | 430 |
| 🇭🇰 Hong Kong | 291 |
| 🇿🇦 South Africa | 161 |
| 🇨🇱 Chile | 131 |
| 🇵🇱 Poland | 130 |
| 🇩🇪 Germany | 128 |
| 🇨🇳 China | 119 |
| 🇺🇸 United States | 106 |
| 🇨🇦 Canada | 85 |
| 🇮🇳 India | 83 |
| 🇨🇺 Cuba | 58 |
| 🇸🇸 South Sudan | 12 |
| Global Average | 106 |
As the table above shows, some regions have a lot more mobile phone subscriptions than people, while other places are lagging behind.
In regions with a surplus, people likely have multiple devices and SIM-enabled gadgets like smartwatches and connected cars. This explains how in Macao, mobile subscriptions are more than 300% higher than the country’s population.
On the flip side, in South Sudan, there are just 12 mobile phone subscriptions for every 100 people in the country. Poverty is widespread across the country, which helps explain its relatively low number of mobile subscriptions. According to the World Bank, only 7.2% of the South Sudan’s population has access to electricity.

This article was published as a part of Visual Capitalist's Creator Program, which features data-driven visuals from some of our favorite Creators around the world.


Technology
Visualizing AI Patents by Country
See which countries have been granted the most AI patents each year, from 2012 to 2022.


Visualizing AI Patents by Country
This was originally posted on our Voronoi app. Download the app for free on iOS or Android and discover incredible data-driven charts from a variety of trusted sources.
This infographic shows the number of AI-related patents granted each year from 2010 to 2022 (latest data available). These figures come from the Center for Security and Emerging Technology (CSET), accessed via Stanford University’s 2024 AI Index Report.
From this data, we can see that China first overtook the U.S. in 2013. Since then, the country has seen enormous growth in the number of AI patents granted each year.
| Year | China | EU and UK | U.S. | RoW | Global Total |
|---|---|---|---|---|---|
| 2010 | 307 | 137 | 984 | 571 | 1,999 |
| 2011 | 516 | 129 | 980 | 581 | 2,206 |
| 2012 | 926 | 112 | 950 | 660 | 2,648 |
| 2013 | 1,035 | 91 | 970 | 627 | 2,723 |
| 2014 | 1,278 | 97 | 1,078 | 667 | 3,120 |
| 2015 | 1,721 | 110 | 1,135 | 539 | 3,505 |
| 2016 | 1,621 | 128 | 1,298 | 714 | 3,761 |
| 2017 | 2,428 | 144 | 1,489 | 1,075 | 5,136 |
| 2018 | 4,741 | 155 | 1,674 | 1,574 | 8,144 |
| 2019 | 9,530 | 322 | 3,211 | 2,720 | 15,783 |
| 2020 | 13,071 | 406 | 5,441 | 4,455 | 23,373 |
| 2021 | 21,907 | 623 | 8,219 | 7,519 | 38,268 |
| 2022 | 35,315 | 1,173 | 12,077 | 13,699 | 62,264 |
In 2022, China was granted more patents than every other country combined.
While this suggests that the country is very active in researching the field of artificial intelligence, it doesn’t necessarily mean that China is the farthest in terms of capability.
Key Facts About AI Patents
According to CSET, AI patents relate to mathematical relationships and algorithms, which are considered abstract ideas under patent law. They can also have different meaning, depending on where they are filed.
In the U.S., AI patenting is concentrated amongst large companies including IBM, Microsoft, and Google. On the other hand, AI patenting in China is more distributed across government organizations, universities, and tech firms (e.g. Tencent).
In terms of focus area, China’s patents are typically related to computer vision, a field of AI that enables computers and systems to interpret visual data and inputs. Meanwhile America’s efforts are more evenly distributed across research fields.
Learn More About AI From Visual Capitalist
If you want to see more data visualizations on artificial intelligence, check out this graphic that shows which job departments will be impacted by AI the most.

-

 Mining1 week ago
Gold vs. S&P 500: Which Has Grown More Over Five Years?
-

 Markets2 weeks ago
Ranked: The Most Valuable Housing Markets in America
-

 Money2 weeks ago
Which States Have the Highest Minimum Wage in America?
-

 AI2 weeks ago
Ranked: Semiconductor Companies by Industry Revenue Share
-

 Markets2 weeks ago
Ranked: The World’s Top Flight Routes, by Revenue
-

 Countries2 weeks ago
Population Projections: The World’s 6 Largest Countries in 2075
-

 Markets2 weeks ago
The Top 10 States by Real GDP Growth in 2023
-

 Demographics2 weeks ago
The Smallest Gender Wage Gaps in OECD Countries