Maps
Mapping Airways: The World’s Flight Paths and Airports
Article/Editing:
Click to view a larger version of the graphic.
Mapping Airways: World’s Flight Paths and Airports
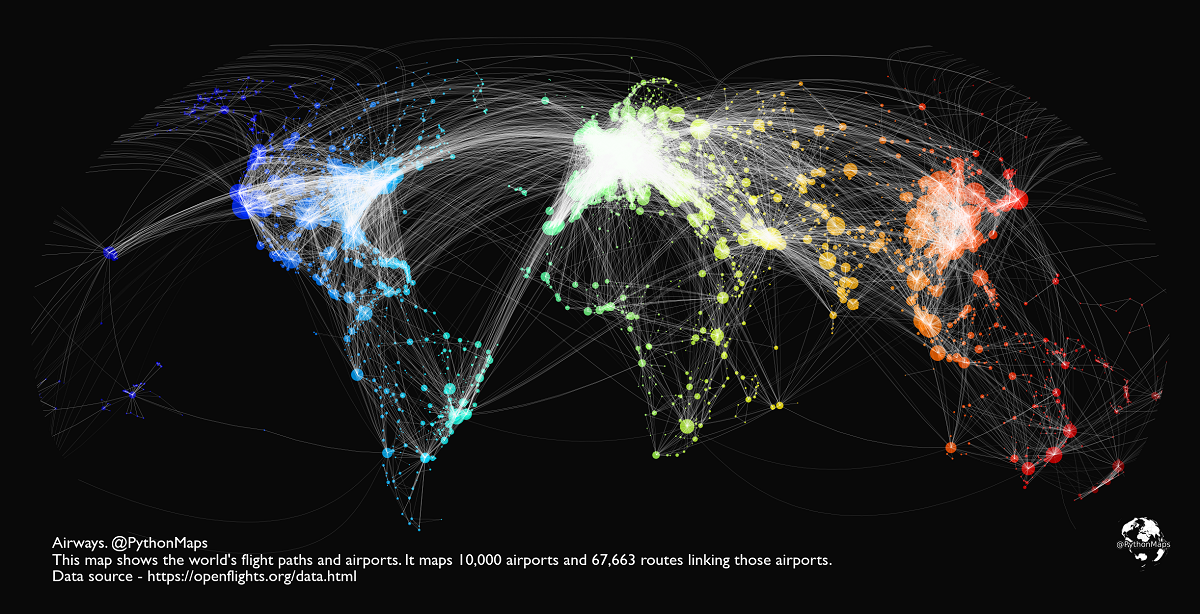
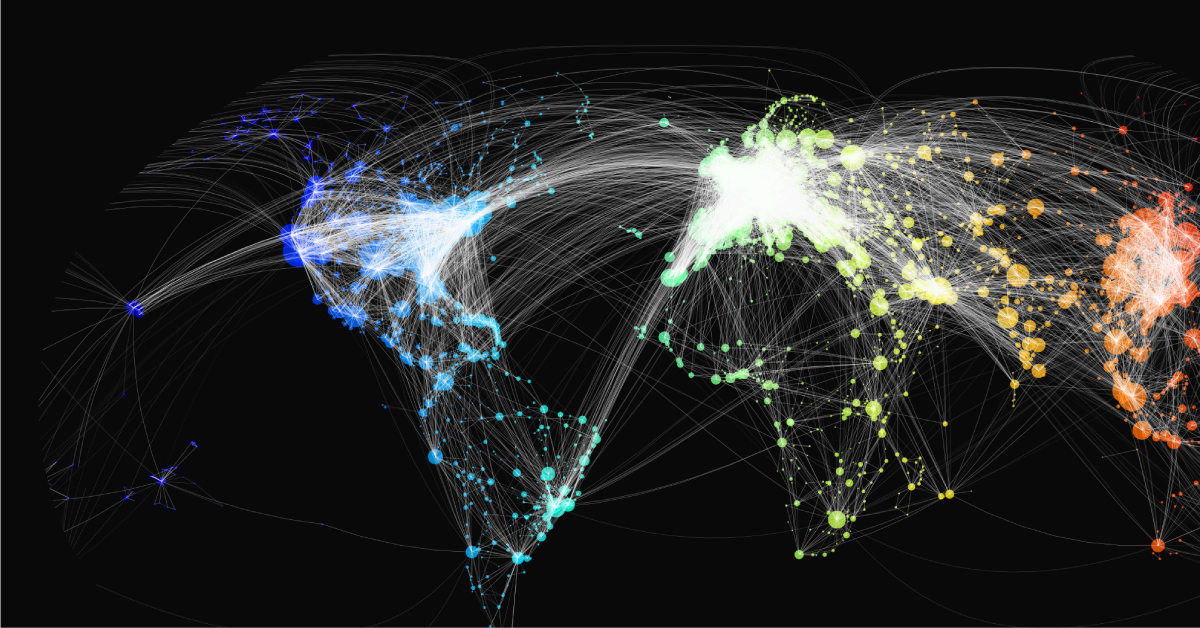
There are up to 8,755 commercial flights in the air at any given time of day. These flights transport thousands of people (and millions of dollars worth of goods) around the world.
But where are these people and goods headed? This map from Adam Symington uses historical data from OpenFlights to visualize the world’s flight paths.
The graphic shows a comprehensive data set encompassing 67,663 different routes that connect 10,000 different airports across the globe.
A Note On the Data
The map uses an OpenFlights database provided by the third-party source that hasn’t been updated since June 2014.
Because of this, the data used for the graphic is of historical value only. However, this detailed map sparked our curiosity and got us wondering—what are some of the busiest aviation hubs around the world right now?
We did some digging, and here’s what we found.
Busiest Airports by Passengers
There are several ways to gauge an airport’s popularity. One way is to measure total passenger traffic throughout the year.
According to Airports Council International (ACI), eight of the top 10 busiest airports for passenger traffic in 2021 were in America. Here’s a look at the top 10 list, as of April 11, 2022:
| Rank | Airport | Country | Passenger Traffic (2021) |
|---|---|---|---|
| 1 | Atlanta GA (ATL) | 🇺🇸 US | 75,704,760 |
| 2 | Dallas/Fort Worth TX (DFW) | 🇺🇸 US | 62,465,756 |
| 3 | Denver CO (DEN) | 🇺🇸 US | 58,828,552 |
| 4 | Chicago IL (ORD) | 🇺🇸 US | 54,020,399 |
| 5 | Los Angeles CA (LAX) | 🇺🇸 US | 48,007,284 |
| 6 | Charlotte NC (CLT) | 🇺🇸 US | 43,302,230 |
| 7 | Orlando FL (MCO) | 🇺🇸 US | 40,351,068 |
| 8 | Guangzhou (CAN) | 🇨🇳 China | 40,259,401 |
| 9 | Chengdu (CTU) | 🇨🇳 China | 40,117,496 |
| 10 | Las Vegas NV (LAS) | 🇺🇸 US | 39,754,366 |
In 2021, the airport with the most passenger traffic was Hartsfield-Jackson Atlanta International Airport. It accommodated more than 75 million passengers last year—a 76.4% increase compared to 2020 figures.
Hartsfield-Jackson is well-known for being one of the busiest airports in the world. One reason for this is its convenient location—according to the airport’s official website, Atlanta is within a two-hour flight from 80% of the U.S. population.
Dallas/Forth Worth (DFW) came in second place, seeing 62.5 million passengers throughout 2021. DFW was one of the only airports to boost its service offerings throughout the pandemic, and is also the main hub for American Airlines, the world’s largest airline by fleet size.
Busiest Airports by Cargo
While the U.S. dominates the ranking when it comes to passenger traffic, the list is much more diverse when looking at air cargo volumes. Here’s a look at the ranking, based on loaded and unloaded freight and mail (including transit freight):
| Rank | Airport | Country | Cargo Traffic (Metric Tonnes, 2021) |
|---|---|---|---|
| 1 | Hong Kong SAR (HKG) | 🇭🇰 Hong Kong | 5,025,495 |
| 2 | Memphis TN (MEM) | 🇺🇸 US | 4,480,465 |
| 3 | Shanghai (PVG) | 🇨🇳 China | 3,982,616 |
| 4 | Anchorage AK (ANC) | 🇺🇸 US | 3,555,160 |
| 5 | Incheon (ICN) | 🇰🇷 South Korea | 3,329,292 |
| 6 | Louisville KY (SDF) | 🇺🇸 US | 3,052,269 |
| 7 | Taipei (TPE) | 🇹🇼 Taiwan | 2,812,065 |
| 8 | Los Angeles CA (LAX) | 🇺🇸 US | 2,691,830 |
| 9 | Tokyo (NRT) | 🇯🇵 Japan | 2,644,074 |
| 10 | Doha (DOH) | 🇶🇦 Qatar | 2,620,095 |
Hong Kong (HKG) takes the top spot since the airport processed more than 5.0 million metric tonnes of freight and mail throughout 2021.
Hong Kong has been known as one of the busiest air cargo hubs for over a decade and is able to maintain this reputation because of its strategic location, impressive infrastructure, efficient customs, and business-friendly trade regulations.
The COVID-19 Impact on Aviation
The global pandemic hit the aviation industry hard. At its lowest point, international travel was down 98% from normal levels.
While the aviation industry is starting to recover from its COVID-induced slump, things still haven’t fully bounced back yet, especially in places like Shanghai, where lockdowns are still being mandated.
But experts remain hopeful for the future. According to ACI World’s General Director Luis Felipe de Oliveira, last year’s recovery was just the beginning.
“With many countries taking steps towards the return of a certain normality, lifting almost all the health measures and travel restrictions as supported by science, we welcome the continuation of air travel demand’s recovery in 2022.”
-Luis Felipe de Oliveira, ACI World’s Director General

This article was published as a part of Visual Capitalist's Creator Program, which features data-driven visuals from some of our favorite Creators around the world.


Demographics
Mapped: U.S. Immigrants by Region
This map shows which regions U.S. immigrants came from, highlighting Asia and Latin America as the biggest sources.


Breaking Down America’s Immigrant Population
This was originally posted on our Voronoi app. Download the app for free on iOS or Android and discover incredible data-driven charts from a variety of trusted sources.
The United States is home to more immigrants than any other nation, surpassing the combined totals of the next four countries: Germany, Saudi Arabia, Russia, and the United Kingdom.
To add context to this impressive fact, we’ve illustrated the regions from which U.S. immigrants originated. “Immigrants” in this context refers to individuals who are residing in the United States but were not U.S. citizens at birth.
These statistics were sourced from the Migration Policy Institute, which analyzed data from the U.S. Census Bureau’s 2022 American Community Survey (ACS).
U.S. Immigrants by Region
From this graphic, we can see that Asia and Latin America emerge as the primary sources of immigration, collectively accounting for 81% of America’s 46.2 million immigrants.
| Region | # of Immigrants | % of Total |
|---|---|---|
| Europe | 4,728,948 | 10 |
| Asia | 14,349,080 | 31 |
| Africa | 2,752,965 | 6 |
| Oceania | 288,560 | 1 |
| Northern America | 828,702 | 2 |
| Latin America | 23,233,834 | 50 |
| Total | 46,182,089 | 100 |
Latin America alone contributes half of the immigrant population. Mexico stands out as the largest contributor to U.S. immigration, with 10.7 million immigrants, attributable to its geographical proximity and historical ties.
Economic factors, including wage disparity and employment opportunities, drive many Mexicans to seek better prospects north of the border.
From Asia, the two largest country sources are China (2.2 million) and India (2.8 million).
Learn More About U.S. Immigration From Visual Capitalist
If you enjoyed this post, be sure to check out Why Do People Immigrate to the U.S.? This visualization shows the different reasons why immigrants chose to come to America in 2021.

-

 Markets4 days ago
Mapped: The Most Valuable Company in Each Southeast Asian Country
-

 Markets2 weeks ago
The Top Private Equity Firms by Country
-

 Jobs2 weeks ago
The Best U.S. Companies to Work for According to LinkedIn
-

 Economy2 weeks ago
Ranked: The Top 20 Countries in Debt to China
-

 Politics1 week ago
Charted: Trust in Government Institutions by G7 Countries
-

 Energy1 week ago
Mapped: The Age of Energy Projects in Interconnection Queues, by State
-

 Mining1 week ago
Visualizing Global Gold Production in 2023
-

 Markets1 week ago
Visualized: Interest Rate Forecasts for Advanced Economies