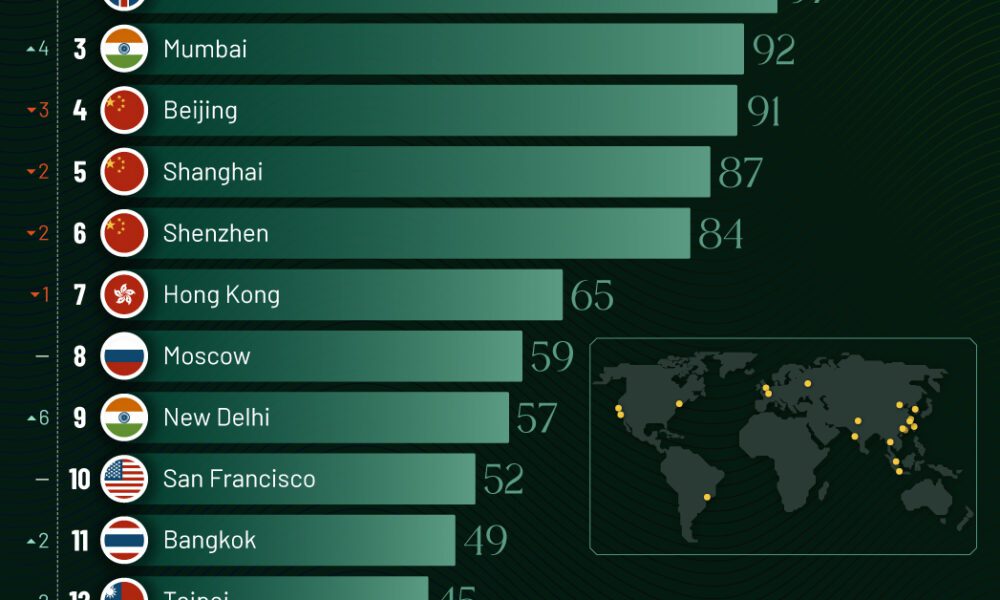
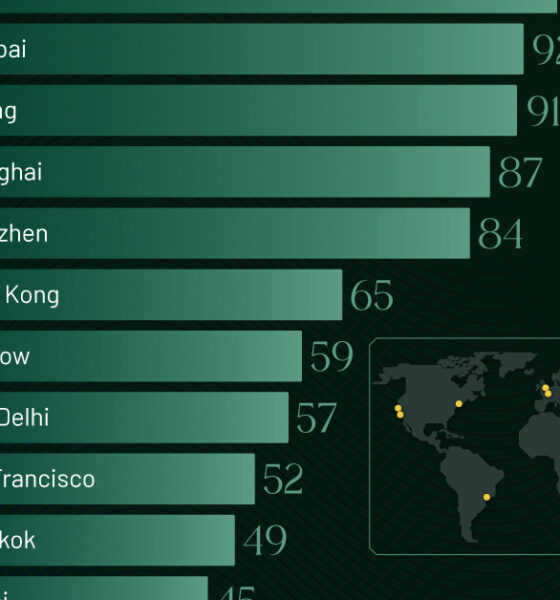
Just two countries account for half of the top 20 cities with the most billionaires. And the majority of the...
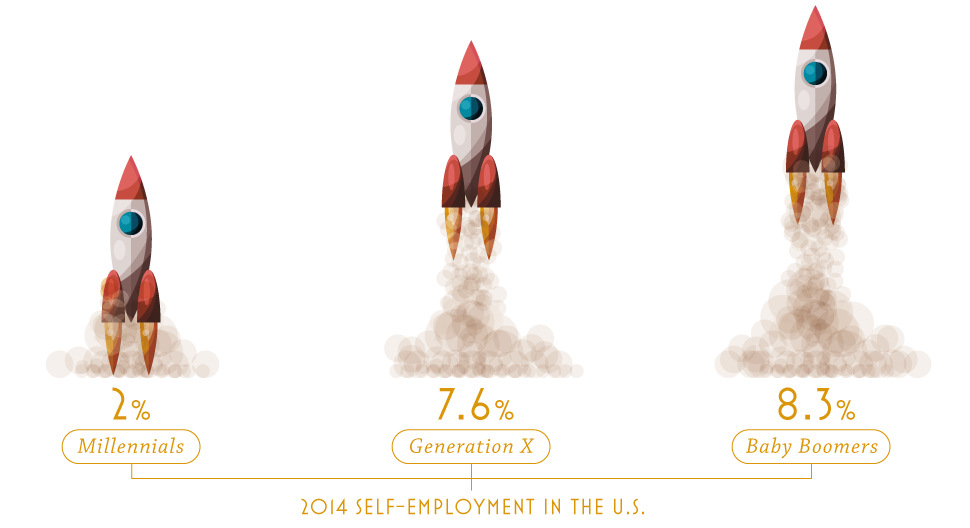
Millennials are off to a slow start with mounting student debt and low savings, but they may eventually be the most entrepreneurial generation of all time.
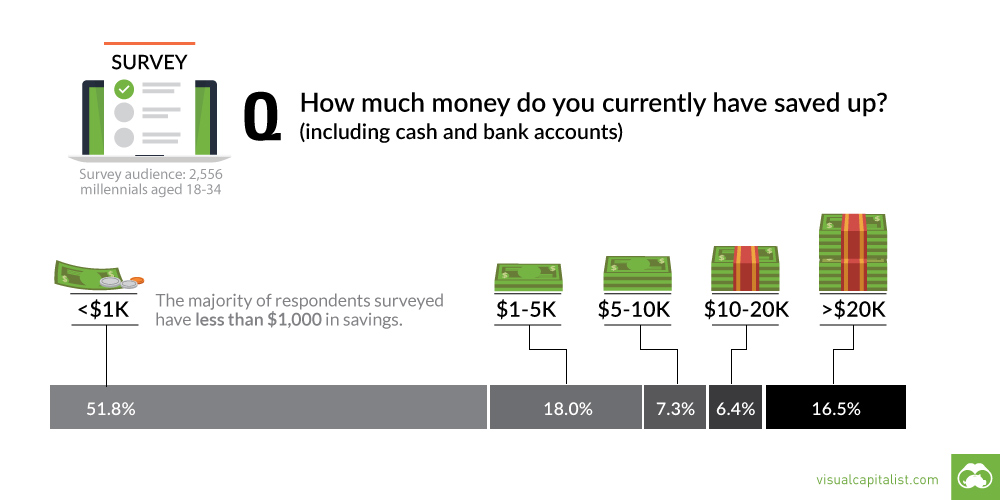
A recent survey shows that most millennials are living paycheck to paycheck. This chart looks at their savings, as well as differences between subgroups.
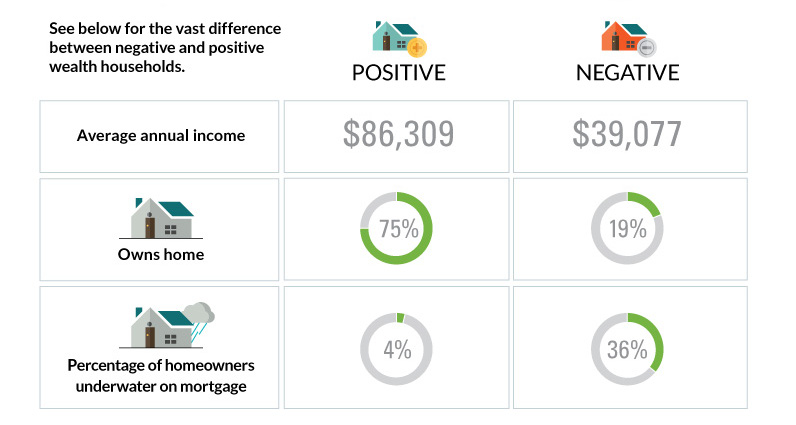
The differences between America's poorest homes - those with negative wealth - and their positive counterparts are stark and numerous.
New financial innovation in technology is quickly shaping a sector that was entrenched as any. See the evolving fintech landscape in this infographic.
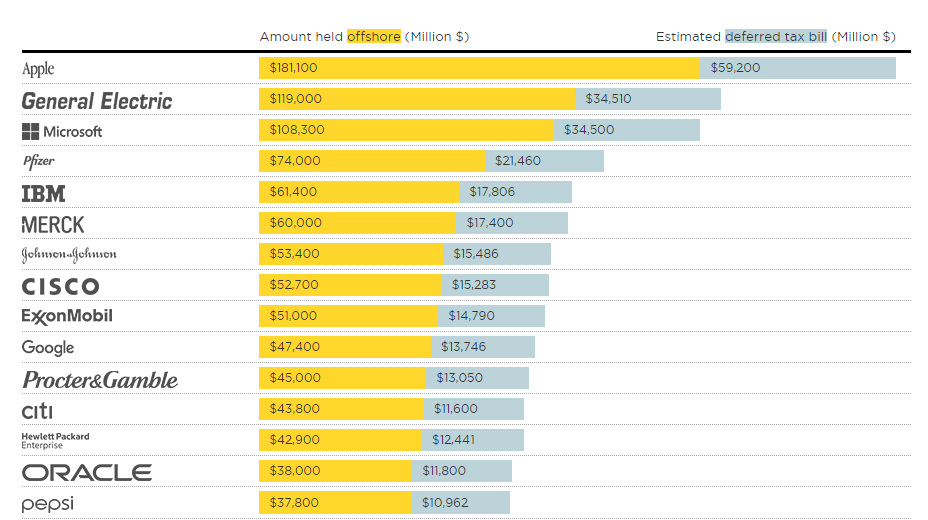
Big companies store billions of dollars in offshore tax havens. Here's the 30 companies in the Fortune 500 that have the most money offshore.
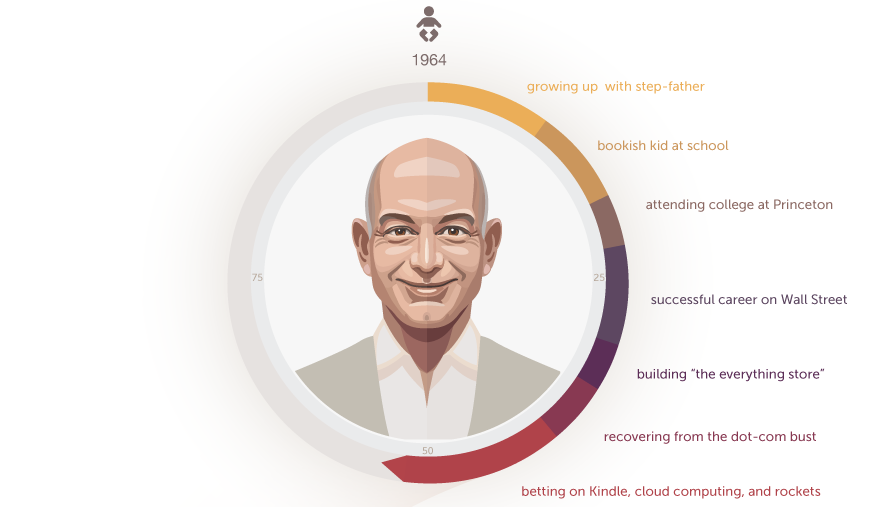
Jeff Bezos just passed Warren Buffett as the third-richest person in the world. See how he built his Amazon Empire in this Jeff Bezos infographic.
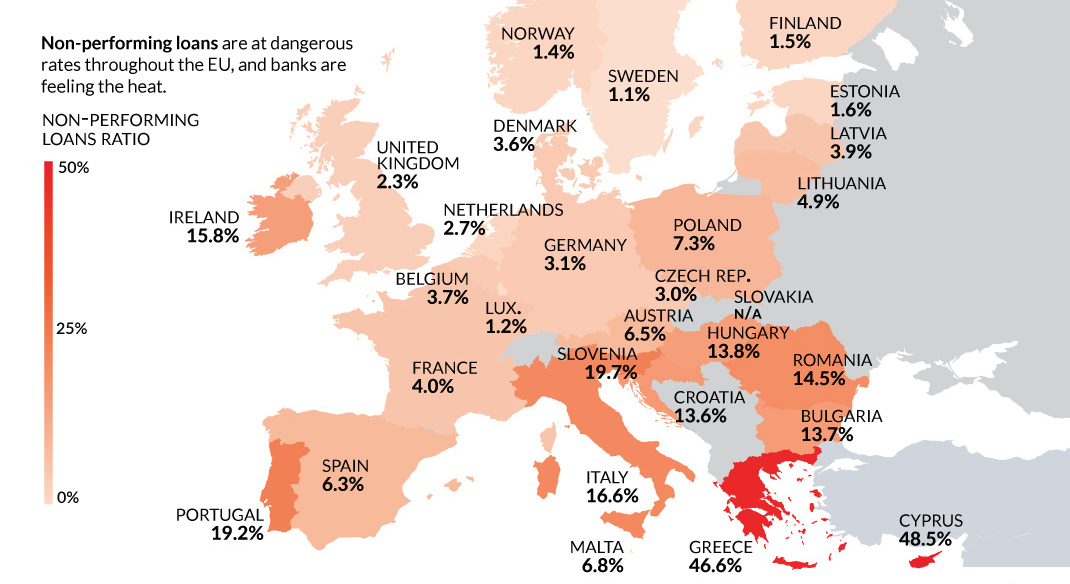
Despite the potential negative economic consequences, there is one reason a Brexit makes sense: non-performing loans and Europe's troubled banking sector.

In 2015, Americans bet $149 billion illegally on sports. But what is legal, what is not? Learn about the sports betting industry in this infographic.
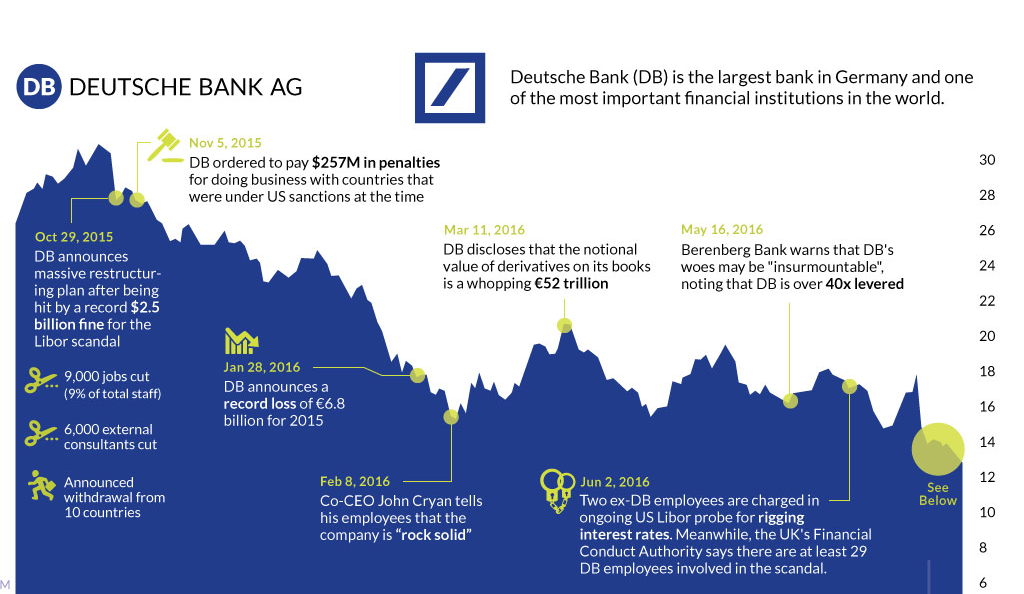
The fate of Germany's largest bank appears to be sealed. This timeline shows the fall of Deutsche Bank, one of Europe's most crucial financial institutions.
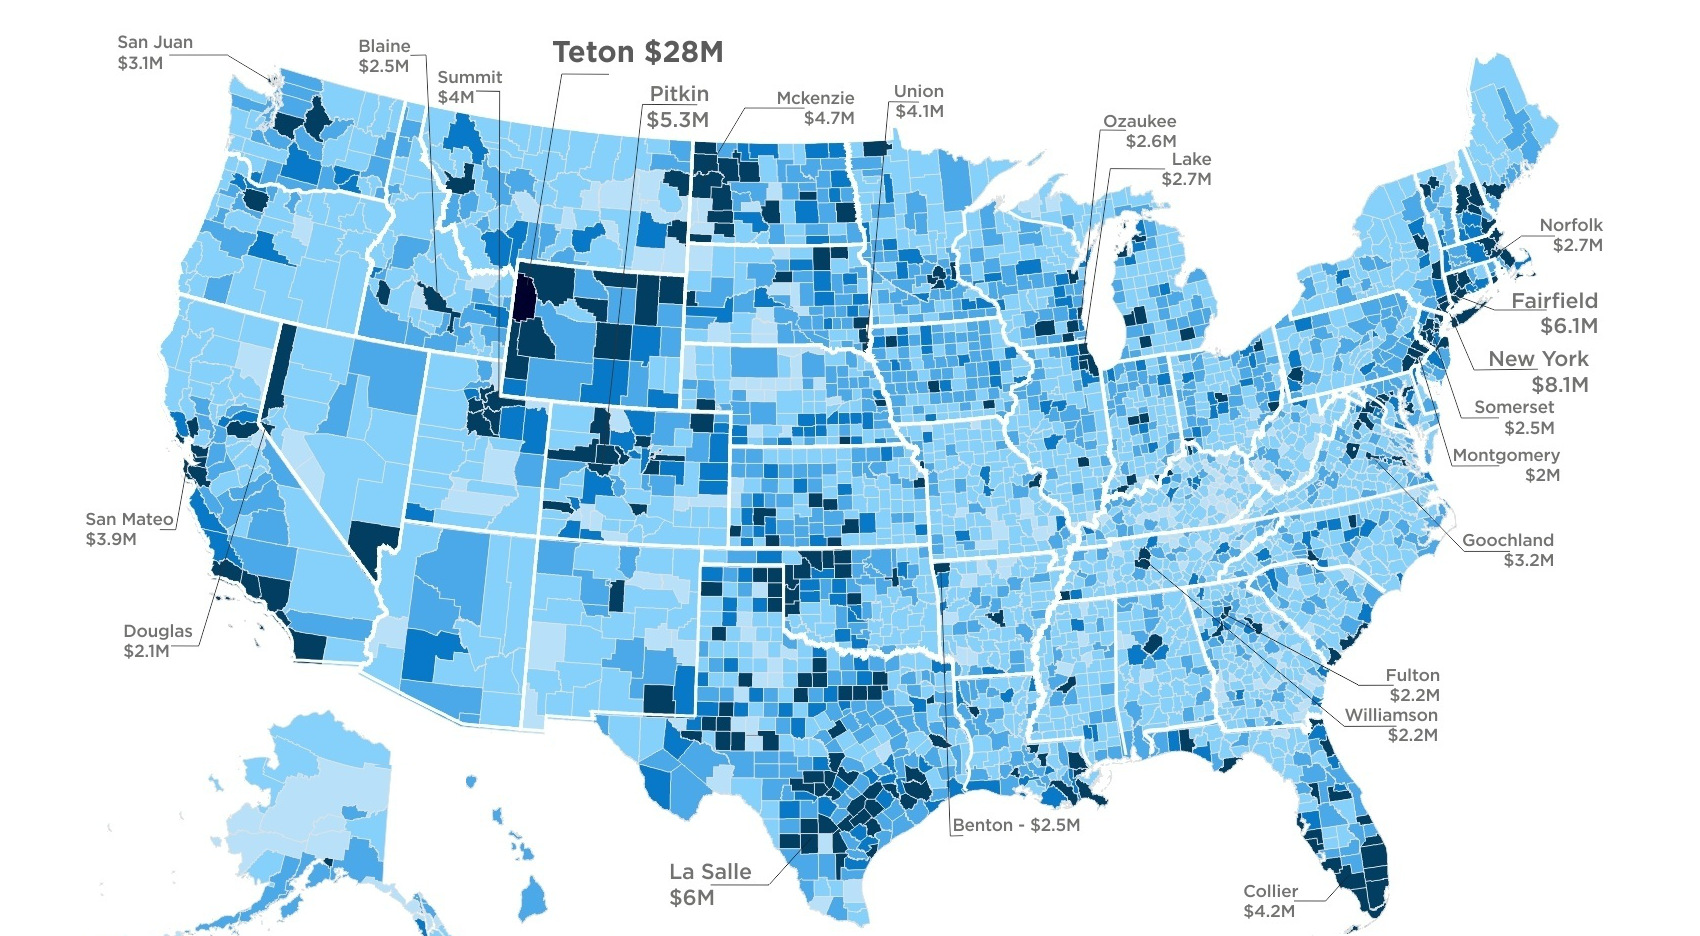
To make it into the Top 1% of US earners, you must make $521k. However, avg income of the 1% varies wildly at a county level,...


