Personal Finance
Chart: Most Millennials Have Less Than $1,000 in Savings
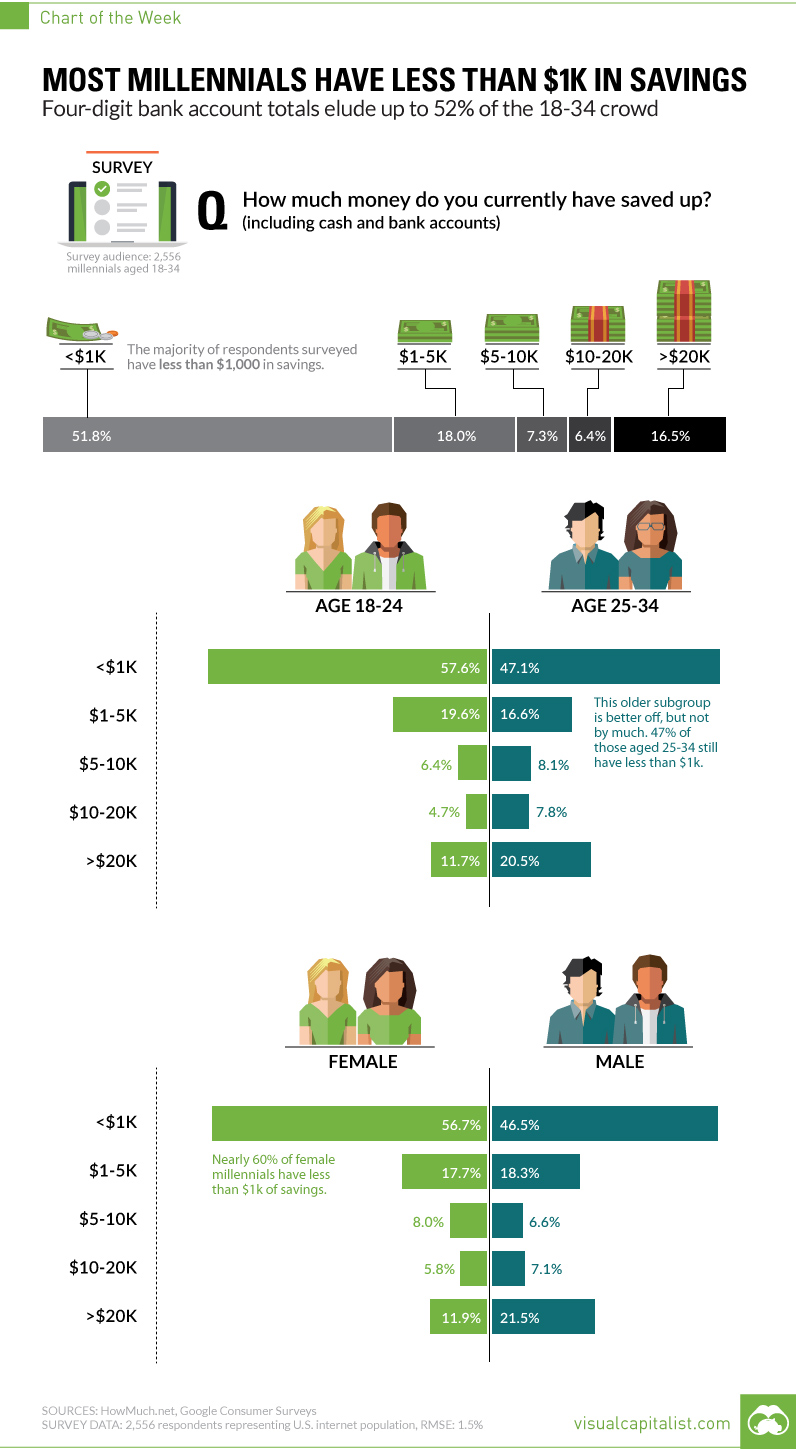
Four-digit bank account totals elude 52% of the 18-34 crowd
The Chart of the Week is a weekly Visual Capitalist feature on Fridays.
The majority of millennials are living paycheck to paycheck.
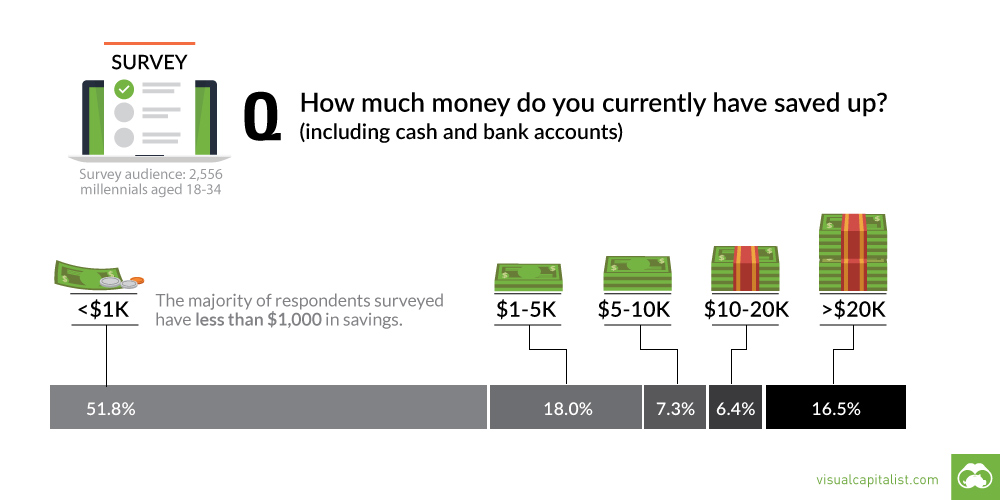
A recent survey of millennials by HowMuch.net found that 51.8% of those aged 18-34 have less than $1,000 held between bank accounts and cash savings.
This echoes previous data we’ve seen – not just on millennials, but Americans in general. For example, we know that 14% of Americans have “negative” wealth. We also know that 62% of Americans don’t have emergency savings that could cover a $1,000 hospital visit or a $500 car repair.
Taking that into consideration, let’s dive deeper into this more recent millennial data.
Younger vs. Older Millennials
The broad survey data can be further divided into “younger” and “older” millennial segments: those aged 18-24, vs. those between 25-34.
Based on the survey question, an intuitive expectation would be that younger millennials are much more likely to have less than $1,000 in savings. After all, many of the people in this group would still be in school, and many are struggling with student debt.
However, the difference is far less than one may expect. While it is true that 57.6% of the younger demographic has less than $1,000 in savings, the older group is not much better off with almost half (47.1%) of them being in the same boat. This shows that many millennials in their late 20s and early 30s are still not able to generate substantial savings.
Male vs. Female Millennials
There is also a significant divide between male and female millennials here, with 56.7% of females having less than $1,000 in savings. Compare this number to the male percentage of 46.5%, and it is clear there is a substantial divide between genders.
Lastly, males are also more likely to have a substantial amount stored away in their bank account. According to the survey, 21.5% of males have more than $20,000 of savings, while only 11.9% females can say the same.
Support the Future of Data Storytelling
Sorry to interrupt your reading, but we have a favor to ask. At Visual Capitalist we believe in a world where data can be understood by everyone. Thatโs why we want to build the VC App - the first app of its kind combining verifiable and transparent data with beautiful, memorable visuals. All available for free.
As a small, independent media company we donโt have the expertise in-house or the funds to build an app like this. So weโre asking our community to help us raise funds on Kickstarter.
If you believe in data-driven storytelling, join the movement and back us on Kickstarter!
Thank you.

Personal Finance
Mapped: Personal Finance Education Requirements, by State
Only 22.7% of U.S. students are required to take a personal finance course. Which states have the highest levels of personal finance education?

The Percentage of Students Receiving Personal Finance Education
When you graduated from high school, did you know how to create a budget? Did you have an understanding of what stocks and bonds were? Did you know how to do your own taxes?
For many Americans, the answer to these questions is probably a โnoโ. Only 22.7% of U.S. high school students are guaranteed to receive a personal finance education. While this is up from 16.4% in 2018, this still represents a small fraction of students.
This graphic uses data from Next Gen Personal Finance (NGPF) to show the percentage of high school students required to take a personal finance course by state.
A Closer Look at State-level Personal Finance Education
A standalone personal finance course was defined as a course that was at least one semester, which is equivalent to 60 consecutive instructional hours. Hereโs the percentage of students in each state who have a required (not optional) personal finance course.
State/Territory | % of Students Required to Take Personal Finance Course |
---|---|
Mississippi | 100.0% |
Missouri | 100.0% |
Virginia | 100.0% |
Tennessee | 99.7% |
Alabama | 99.6% |
Utah | 99.6% |
Iowa | 91.3% |
North Carolina | 89.2% |
Oklahoma | 47.1% |
New Jersey | 43.0% |
Nebraska | 42.8% |
Kansas | 40.8% |
Wyoming | 38.3% |
Arkansas | 34.6% |
Wisconsin | 33.5% |
South Dakota | 27.1% |
Ohio | 23.5% |
Pennsylvania | 16.2% |
Maine | 15.6% |
Rhode Island | 14.8% |
Connecticut | 14.7% |
Illinois | 13.9% |
Maryland | 12.5% |
North Dakota | 12.2% |
Vermont | 12.1% |
Nevada | 11.0% |
Indiana | 10.9% |
Oregon | 7.5% |
Minnesota | 6.9% |
Montana | 6.9% |
New Hampshire | 6.0% |
Kentucky | 5.5% |
Colorado | 5.4% |
Delaware | 5.0% |
Massachusetts | 5.0% |
West Virginia | 3.2% |
Louisiana | 2.7% |
Washington | 2.4% |
Texas | 2.2% |
New York | 2.0% |
Michigan | 1.7% |
Idaho | 1.4% |
Arizona | 1.0% |
California | 0.8% |
South Carolina | 0.8% |
Alaska | 0.6% |
Florida | 0.4% |
New Mexico | 0.4% |
Georgia | 0.0% |
Hawaii | 0.0% |
Washington, D.C. | 0.0% |
Eight states currently have state-wide requirements for a personal finance course: Alabama, Mississippi, Missouri, Iowa, North Carolina, Tennessee, Utah, and Virginia. Naturally, the level of personal finance education is highest in these states.
Five states have begun the process of implementing a requirement, with Florida being the most populous state yet to guarantee personal finance education for high schoolers. The state previously required schools to offer a personal finance course as an elective, but only 5% of students took the course.
Outside of the guarantee states, only 9.3% of students are required to take a personal finance course. That number drops to 5% for schools that have a high percentage of Black or Brown students, while students eligible for a free or reduced lunch program (i.e. lower income students) also hover at the 5% number.
Why is Personal Financial Education Important?
The majority of Americans believe parents are responsible for teaching their children about personal finance. However, nearly a third of parents say they never talk to their children about finances. Personal finance education at school is one way to help fill that gap.
People who have received a financial education tend to have a higher level of financial literacy. In turn, this can lead to people being less likely to face financial difficulties.
People with low levels of financial literacy were five times more likely to be unable to cover one month of living expenses, when compared to people with high financial literacy. Separate research has found that implementing a state mandate for personal finance education led to improved credit scores and reduced delinquency rates.
Not only that, financial education can play a key role in building wealth. One survey found that only one-third of millionaires averaged a six-figure income over the course of their career. Instead of relying on high salaries, the success of most millionaires came from employing basic personal finance principles: investing early and consistently, avoiding credit card debt, and spending carefully using tools like budgets and coupons.
Expanding Access to Financial Education
Once the in-progress state requirements have been fully implemented, more than a third of U.S. high school students will have guaranteed access to a personal finance course. Momentum is expanding beyond guarantee states, too. There are 48 personal finance bills pending in 18 states according to NGPFโs financial education bill tracker.
Importantly, 88% of surveyed adults support personal finance education mandatesโand most wish they had also been required to take a personal finance course themselves.
When we ask the next generation of graduates if they understand how to build a budget, it’s more likely that they will confidently say โyesโ.
Personal Finance
Ranked: The Best and Worst Pension Plans, by Country
Which countries are best equipped to support their elderly citizens? This graphic compares pension plans around the world.

The Best and Worst Pension Plans Worldwide
Each year, millions of people around the world leave the workforce to retire.
But as the global population grows older, and the COVID-19 pandemic accelerates the already rising number of retirees, there is still a large degree of variance in the quality of public pension plans around the world.
Which countries have invested in robust public pension programs, and which lag behind?
This graphic, using 2021 data from Mercer CFA Institute Global Pension Index, compares retirement income systems worldwide.
How the Index Ranks Pension Plans
Because a countryโs pension system is unique to its particular economic and historical context, itโs difficult to draw direct comparisons. However, there are certain elements that pension experts see as universally positive, and that lead to better financial support for older citizens.
As with previous rankings, Mercer and the CFA Institute organized these universal elements into three sub-indexes:
- Adequacy: The base-level of income, as well as the design of a regionโs private pension system.
- Sustainability: The state pension age, the level of advanced funding from the government, and the level of government debt.
- Integrity: Regulations and governance put in place to protect plan members.
These three measures were used to rank the pension system of 43 different countries, representing more than 65% of the worldโs population. This yearโs iteration of the index notably includes four new countriesโIceland, Taiwan, UAE, and Uruguay.
The Full Ranking
When it comes to the best pension plans across the globe, Iceland, the Netherlands, and Denmark have the top three systems.
Country | Overall Value | Adequacy | Sustainability | Integrity |
---|---|---|---|---|
๐ฆ๐ท Argentina | 41.5 | 52.7 | 27.7 | 43.0 |
๐ฆ๐บ Australia | 75.0 | 67.4 | 75.7 | 86.3 |
๐ฆ๐น Austria | 53.0 | 65.3 | 23.5 | 74.5 |
๐ง๐ช Belgium | 64.5 | 74.9 | 36.3 | 87.4 |
๐ง๐ท Brazil | 54.7 | 71.2 | 24.1 | 71.2 |
๐จ๐ฆ Canada | 69.8 | 69.0 | 65.7 | 76.7 |
๐จ๐ฑ Chile | 67.0 | 57.6 | 68.8 | 79.3 |
๐จ๐ณ China | 55.1 | 62.6 | 43.5 | 59.4 |
๐จ๐ด Colombia | 58.4 | 62.0 | 46.2 | 69.8 |
๐ฉ๐ฐ Denmark | 82.0 | 81.1 | 83.5 | 81.4 |
๐ซ๐ฎ Finland | 73.3 | 71.4 | 61.5 | 93.1 |
๐ซ๐ท France | 60.5 | 79.1 | 41.8 | 56.8 |
๐ฉ๐ช Germany | 67.9 | 79.3 | 45.4 | 81.2 |
๐ญ๐ฐ Hong Kong | 61.8 | 55.1 | 51.1 | 87.7 |
๐ฎ๐ธ Iceland | 84.2 | 82.7 | 84.6 | 86.0 |
๐ฎ๐ณ India | 43.3 | 33.5 | 41.8 | 61.0 |
๐ฎ๐ฉ Indonesia | 50.4 | 44.7 | 43.6 | 69.2 |
๐ฎ๐ช Ireland | 68.3 | 78.0 | 47.4 | 82.1 |
๐ฎ๐ฑ Israel | 77.1 | 73.6 | 76.1 | 83.9 |
๐ฎ๐น Italy | 53.4 | 68.2 | 21.3 | 74.9 |
๐ฏ๐ต Japan | 49.8 | 52.9 | 37.5 | 61.9 |
๐ฐ๐ท Korea | 48.3 | 43.4 | 52.7 | 50.0 |
๐ฒ๐พ Malaysia | 59.6 | 50.6 | 57.5 | 76.8 |
๐ฒ๐ฝ Mexico | 49.0 | 47.3 | 54.7 | 43.8 |
๐ณ๐ฑ Netherlands | 83.5 | 82.3 | 81.6 | 87.9 |
๐ณ๐ฟ New Zealand | 67.4 | 61.8 | 62.5 | 83.2 |
๐ณ๐ด Norway | 75.2 | 81.2 | 57.4 | 90.2 |
๐ต๐ช Peru | 55.0 | 58.8 | 44.2 | 64.1 |
๐ต๐ญ Philippines | 42.7 | 38.9 | 52.5 | 35.0 |
๐ต๐ฑ Poland | 55.2 | 60.9 | 41.3 | 65.6 |
๐ธ๐ฆ Saudi Arabia | 58.1 | 61.7 | 50.9 | 62.5 |
๐ธ๐ฌ Singapore | 70.7 | 73.5 | 59.8 | 81.5 |
๐ฟ๐ฆ South Africa | 53.6 | 44.3 | 46.5 | 78.5 |
๐ช๐ธ Spain | 58.6 | 72.9 | 28.1 | 78.3 |
๐ธ๐ช Sweden | 72.9 | 67.8 | 73.7 | 80.0 |
๐จ๐ญ Switzerland | 70.0 | 65.4 | 67.2 | 81.3 |
๐น๐ผ Taiwan | 51.8 | 40.8 | 51.9 | 69.3 |
๐น๐ญ Thailand | 40.6 | 35.2 | 40.0 | 50.0 |
๐น๐ท Turkey | 45.8 | 47.7 | 28.6 | 66.7 |
๐ฆ๐ช UAE | 59.6 | 59.7 | 50.2 | 72.6 |
๐ฌ๐ง UK | 71.6 | 73.9 | 59.8 | 84.4 |
๐บ๐พ Uruguay | 60.7 | 62.1 | 49.2 | 74.4 |
๐บ๐ฒ U.S. | 61.4 | 60.9 | 63.6 | 59.2 |
Average | 61.0 | 62.2 | 51.7 | 72.1 |
Icelandโs system ranks high across all three sub-indexes. The country offers a state pension with two components: mandatory contributions from both employees and employers, and optional contributions to state-approved pension products.
Its system has a high contribution rate, which ultimately results in a generous state pension that retirees in Iceland can tap into. The country also has a relatively low gender pension gap, meaning the difference between the average female pension versus male pension is relatively smallโespecially compared to other OECD countries.
On the opposite end of the spectrum, the Philippines, Argentina, and Thailand scored the lowest on the ranking.
Thailand scores particularly low in the adequacy category, with a score of 35.2. To increase its score, Thailand could increase the minimum payments for its poorest demographic and include more employees in occupational pension schemes.
Recommendations for Better Pension Plans
According to the index, countries seem to be steadily improving their pension systems. From 2020 to 2021, the average score of the overall index increased by 1.0.
With an average of 60.7, the index shows that most countries’ systems have some good features, but they also have some significant shortcomings that could be addressed by the following recommendations:
- Boosting adequacy by increasing coverage, and including more employees in private pensions systems.
- Increasing sustainability by adjusting retirement pension age to reflect increasing life expectancy, and promoting higher workforce participation from older citizens.
- Raise integrity by introducing policies that reduce the gender pension gap and discrepancies amongst minorities.
Countries that implement even a few of these changes could make a huge difference for their next generation of retireesโand those that donโt could be in trouble in the near future.
-
Money2 weeks ago
Mapping the Migration of the Worldโs Millionaires
-
Markets2 weeks ago
Visualizing the Coming Shift in Global Economic Power (2006-2036p)
-
Datastream3 weeks ago
Ranked: These Are 10 of the World’s Least Affordable Housing Markets
-
Demographics1 week ago
Mapped: A Decade of Population Growth and Decline in U.S. Counties
-
Misc3 weeks ago
Visualizing Well-Known Airlines by Fleet Composition
-
Politics4 weeks ago
Which Countries Trust Their Government, and Which Ones Don’t?
-
Markets4 weeks ago
Ranked: Visualizing the Largest Trading Partners of the U.S.
-
Misc1 week ago
Iconic Infographic Map Compares the World’s Mountains and Rivers