Technology
A Visual History of the Largest Companies by Market Cap (1999-Today)
A Visual History of the Largest Companies by Market Cap
The macro narrative that underlies the market is constantly under revision.
While this is partially a function of shifts in investor sentiment, it’s also driven by game-changing events as well as much more structural market forces.
For example, how does the macro narrative change after a commodity price crash? What about when the unprecedented scale of technology is truly understood by the market?
An Evolving Narrative
In this week’s chart, we look at how the big picture narrative has changed over time by using a very simple approach.
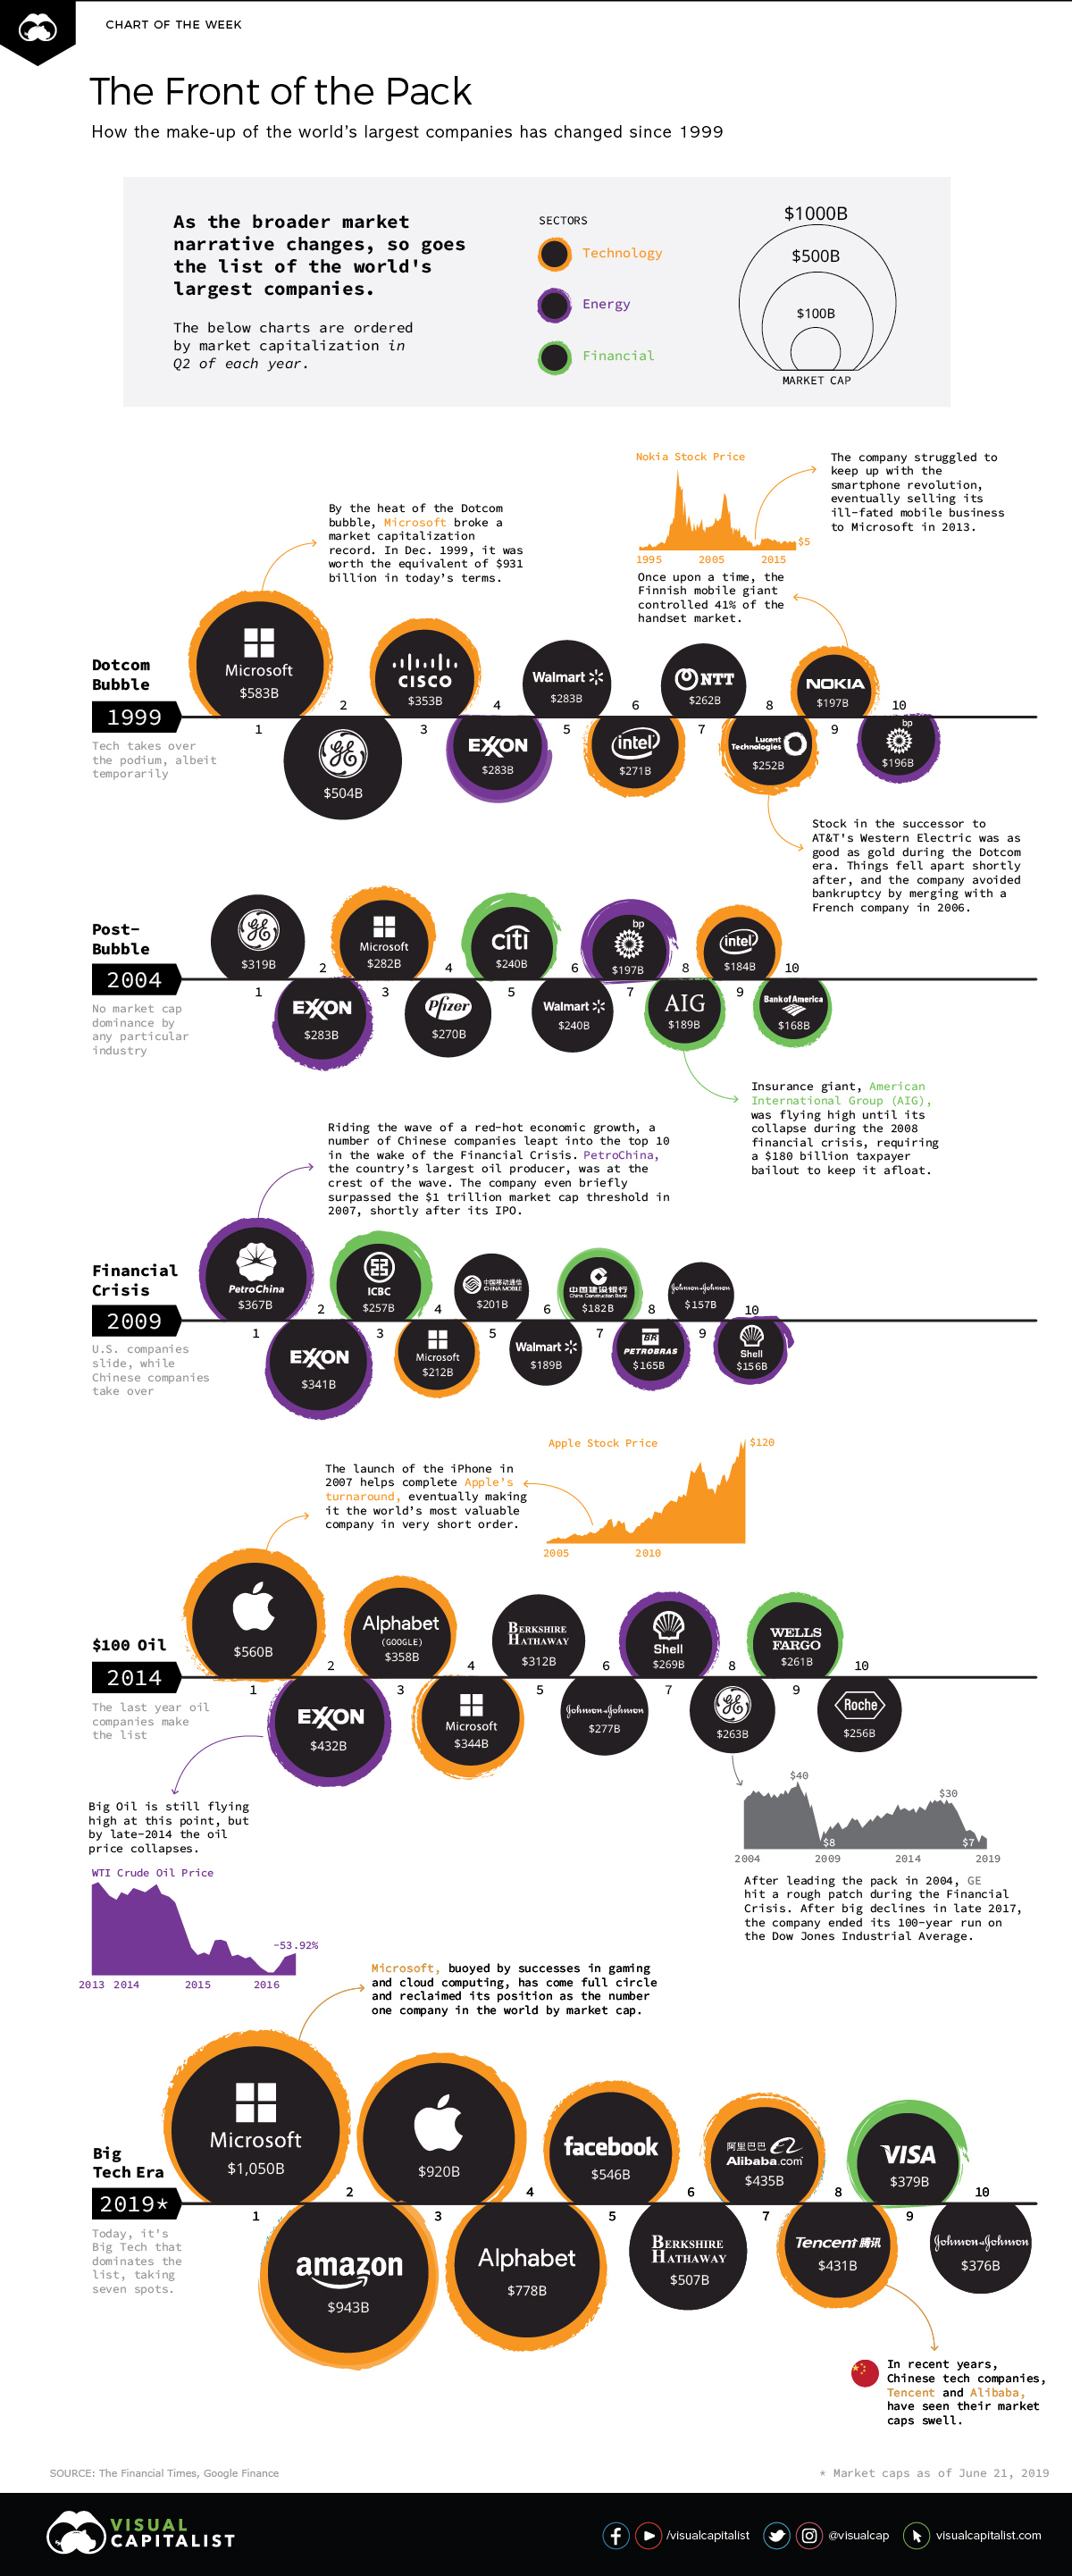
We have visualized the market capitalizations of the 10 largest public companies in the world over five-year intervals from 1999 until today, and it gives us a series of snapshots of what the market was “thinking” during these specific periods.
Not only is it evident as certain industries rise to prominence, but there are also some interesting individual stories to follow. We can see iconic companies – such as Apple – ascend into the public consciousness, while others fall off the radar completely.
| Year | Description | Top Company | Who Dominates Top 10? |
|---|---|---|---|
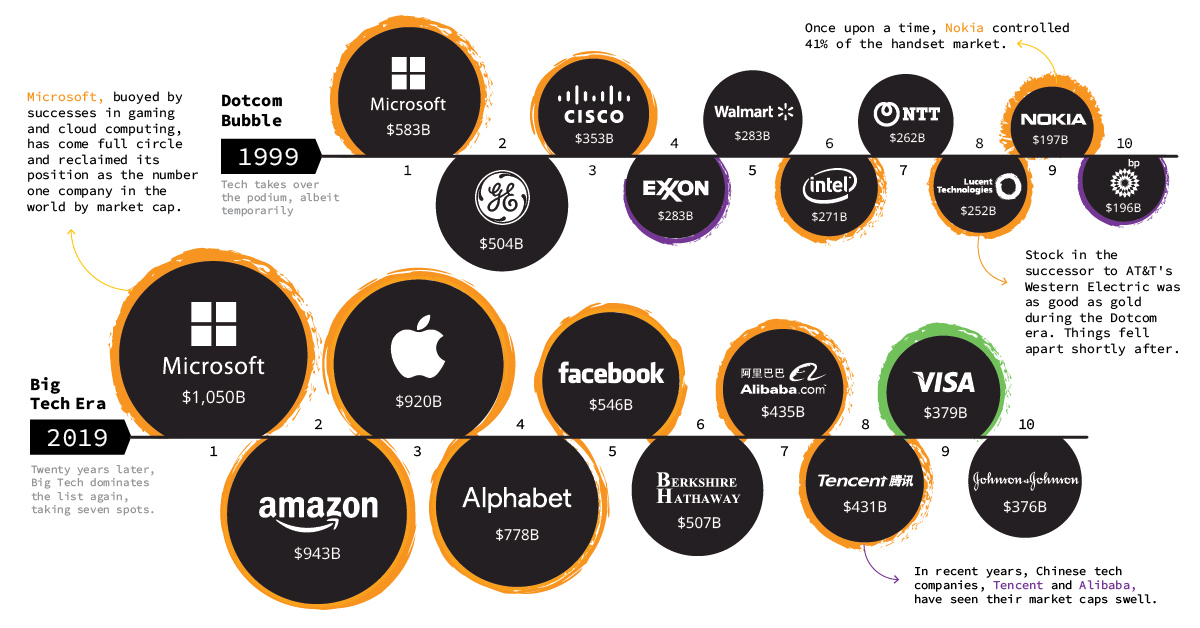
| 1999 | Dotcom Bubble | Microsoft ($583B) | Five tech companies in the mix |
| 2004 | Post-Bubble | GE ($319B) | Diverse mix of companies by industry |
| 2009 | Financial Crisis | PetroChina ($367B) | Six non-U.S. companies make list |
| 2014 | $100 Oil | Apple ($560B) | Last year for oil companies, tech starts ascending |
| 2019 | Big Tech Era | Microsoft ($1,050B) | Seven companies are tech |
The composition of the top 10 changes in each of the snapshots above, and this simple approach helps capture the market narrative for each timeframe.
During the Dotcom Bubble, you can see that half of the list was dominated by tech companies. This was short-lived, and the years 2004, 2009, and 2014 have much more diverse lists.
You can also see the impact of the financial crisis on U.S. company valuations. In 2009, there is an equal distribution of Chinese and American companies. Royal Dutch Shell (UK/Netherlands) and Petrobras (Brazil) help round out the top 10.
Finally, over the last five years, you can see the impact of lower oil prices and the growing scale of tech. Back in 2014, Exxon Mobil was the second largest company in the world by a solid margin, but today it’s been displaced by companies like Facebook, Amazon, Tencent, and Alibaba.
The Big Tech Era
Here is the current top 10 list of the world’s largest companies by market cap:
| Rank | Company | Industry | Market Cap |
|---|---|---|---|
| #1 | 🇺🇸 Microsoft | Tech | $1,050 billion |
| #2 | 🇺🇸 Amazon | Tech | $943 billion |
| #3 | 🇺🇸 Apple | Tech | $920 billion |
| #4 | 🇺🇸 Alphabet | Tech | $778 billion |
| #5 | Tech | $546 billion | |
| #6 | 🇺🇸 Berkshire Hathaway | Diversified | $507 billion |
| #7 | 🇨🇳 Alibaba | Tech | $435 billion |
| #8 | 🇨🇳 Tencent | Tech | $431 billion |
| #9 | 🇺🇸 Visa | Financial | $379 billion |
| #10 | 🇺🇸 Johnson & Johnson | Consumer Goods | $376 billion |
In total, the five biggest tech giants brought in a combined $801.5 billion in revenue last year, and $139 billion in net income.
The Staying Power of Microsoft
With a valuation today of just over $1 trillion, Microsoft is again the world’s largest company by market capitalization.
In this way, the above lists come full circle, since Microsoft was also the biggest company in 1999.
While the software giant experienced short periods where it did drop out of favor, Microsoft was the only company to make the list in our five snapshots above.


Technology
Visualizing AI Patents by Country
See which countries have been granted the most AI patents each year, from 2012 to 2022.


Visualizing AI Patents by Country
This was originally posted on our Voronoi app. Download the app for free on iOS or Android and discover incredible data-driven charts from a variety of trusted sources.
This infographic shows the number of AI-related patents granted each year from 2010 to 2022 (latest data available). These figures come from the Center for Security and Emerging Technology (CSET), accessed via Stanford University’s 2024 AI Index Report.
From this data, we can see that China first overtook the U.S. in 2013. Since then, the country has seen enormous growth in the number of AI patents granted each year.
| Year | China | EU and UK | U.S. | RoW | Global Total |
|---|---|---|---|---|---|
| 2010 | 307 | 137 | 984 | 571 | 1,999 |
| 2011 | 516 | 129 | 980 | 581 | 2,206 |
| 2012 | 926 | 112 | 950 | 660 | 2,648 |
| 2013 | 1,035 | 91 | 970 | 627 | 2,723 |
| 2014 | 1,278 | 97 | 1,078 | 667 | 3,120 |
| 2015 | 1,721 | 110 | 1,135 | 539 | 3,505 |
| 2016 | 1,621 | 128 | 1,298 | 714 | 3,761 |
| 2017 | 2,428 | 144 | 1,489 | 1,075 | 5,136 |
| 2018 | 4,741 | 155 | 1,674 | 1,574 | 8,144 |
| 2019 | 9,530 | 322 | 3,211 | 2,720 | 15,783 |
| 2020 | 13,071 | 406 | 5,441 | 4,455 | 23,373 |
| 2021 | 21,907 | 623 | 8,219 | 7,519 | 38,268 |
| 2022 | 35,315 | 1,173 | 12,077 | 13,699 | 62,264 |
In 2022, China was granted more patents than every other country combined.
While this suggests that the country is very active in researching the field of artificial intelligence, it doesn’t necessarily mean that China is the farthest in terms of capability.
Key Facts About AI Patents
According to CSET, AI patents relate to mathematical relationships and algorithms, which are considered abstract ideas under patent law. They can also have different meaning, depending on where they are filed.
In the U.S., AI patenting is concentrated amongst large companies including IBM, Microsoft, and Google. On the other hand, AI patenting in China is more distributed across government organizations, universities, and tech firms (e.g. Tencent).
In terms of focus area, China’s patents are typically related to computer vision, a field of AI that enables computers and systems to interpret visual data and inputs. Meanwhile America’s efforts are more evenly distributed across research fields.
Learn More About AI From Visual Capitalist
If you want to see more data visualizations on artificial intelligence, check out this graphic that shows which job departments will be impacted by AI the most.

-

 Mining1 week ago
Gold vs. S&P 500: Which Has Grown More Over Five Years?
-

 Markets2 weeks ago
Ranked: The Most Valuable Housing Markets in America
-

 Money2 weeks ago
Which States Have the Highest Minimum Wage in America?
-

 AI2 weeks ago
Ranked: Semiconductor Companies by Industry Revenue Share
-

 Markets2 weeks ago
Ranked: The World’s Top Flight Routes, by Revenue
-

 Countries2 weeks ago
Population Projections: The World’s 6 Largest Countries in 2075
-

 Markets2 weeks ago
The Top 10 States by Real GDP Growth in 2023
-

 Demographics2 weeks ago
The Smallest Gender Wage Gaps in OECD Countries