Mining
Global Gold Mine and Deposit Rankings 2013

For a second year in a row, we have worked with Roy Sebag of Natural Resource Holdings to produce an in-depth report of all gold deposits hold be public, private, and government backed companies.
— View the full 40 page PDF report. —
Results Discussion
We were able to identify a total of 580 deposits that have over 1,000,000 ounces of gold for a total of 3.72 billion in-situ ounces. The average grade of all deposits is 1.01 g/t Au.
These deposits are owned by 312 entities including public, private, and government sponsored corporations. 261 of the deposits were owned (or partially owned) by independent junior miners.
2013 vs Previous Years
It is our belief that this is by far the most comprehensive report yet. That said, those that compare this report to 2012 will notice significant differences in the final metrics. Most notably:
- Total deposits over 1 million oz increased from 439 to 580 worldwide.
- Total ounces have increased from 3.02 billion oz to 3.72 billion oz of Au.
- Average grade has increased from 0.82 g/t to 1.01 g/t Au.
The chief difference is that this year we decided to include all African deposits and mines, including projects that we believe will never be mined because they did not meet our thresholds of grade or depth. However, by including these projects, which add up to about 350 million oz alone, we believe the report is much more encompassing.
Trends in Size and Grade
The project economics of gold deposits are mostly dependent on two major factors: size and grade. Without a sizeable ore body, a mining operation cannot acquire the economies of scale to bring down the cost of production. Likewise, a project without grade may not have the margins for each ton of ore processed to justify production.
The average grade differed significantly between producing and undeveloped deposits. The average grade of all producing mines is 1.18 g/t Au, which is 32.6% higher than the average of all projects still in the development phase (0.89 g/t Au). This has significant implications on future gold production. In the near term, with significant volatility and the gold price at a three-year low, many of these projects are simply not economically feasible. In the medium to long term, unless major discoveries are made, either gold production must decrease (with a focus on only higher grade deposits) or the price of gold must rise to make these projects economical.
A key take home point of this report each year is the rarity of large, high-grade projects. There are only 51 (8.8%) projects in the world that are more than 5 million oz and have an average grade of higher than 3 g/t Au. Of these, there are only 21 that are not yet in production.
By Geography
While North America shows the largest amount of contained gold, Africa continues to be home to some of the highest grade (and highest risk) projects on the planet.
The highest grade deposits in the world are in countries such as South Africa, Tanzania, DRC, Mali, Russia, Ghana, Ivory Coast, Ecuador, Kyrgyzstan, and Papua New Guinea.
The Future of Gold Supply
Our figure for in-situ ounces that we have provided (3.72 billion oz Au) is a comprehensive view of what is below ground in terms of reserves and resources.
However, to come up with a clear picture of what is actually recoverable, the reality is that there are several limitations to the amount of gold that will actually become part of the future supply chain:
- Economic pit outlines have not yet been applied.
- Metallurgical recovery rates have not yet been applied.
- Inferred resources have been included in global contained ounces.
- Undeveloped deposits with no clear path towards permitting remain included.
To project an accurate figure, we need to take our 3.72 billion oz number and apply some math:
Total in-situ ounces in database:
3,720,865,356 oz
70% of total become mines:
2,604,605,749 oz
70% metallurgical recovery rate:
1,823,224,024 oz
This number, 1.82 billion oz, becomes really interesting when we look at annual extractable supply. Averaged over 50 years, the supply is equal to 1,134 tonnes (36,464,480 oz) of gold per year.
This figure is equal to only 42.0% of the 2,700 tonnes (86,807,016 oz) of worldwide gold production in 2012.
Conclusion
Led by countries such as Russia and China, central banks have recently become net buyers of gold. Meanwhile, ETF gold outflows have been a temporary source of supply this year, but obviously this cannot persist. It’s also unreasonable to assume that recycling will make up a significantly greater piece of supply without the price of gold increasing substantially.
With the grade of current producing gold mines being 32.6% higher than undeveloped deposits, it makes the supply scenario even more clear. Not only is the current yearly mine supply difficult to sustain, but future mines coming online will be challenged by grade and margins to be economical at today’s prices.
Mathematically, unless we have high-grade, high ounce deposits that are being fast tracked online, it will be very difficult to find a way to get supply to match demand.


Mining
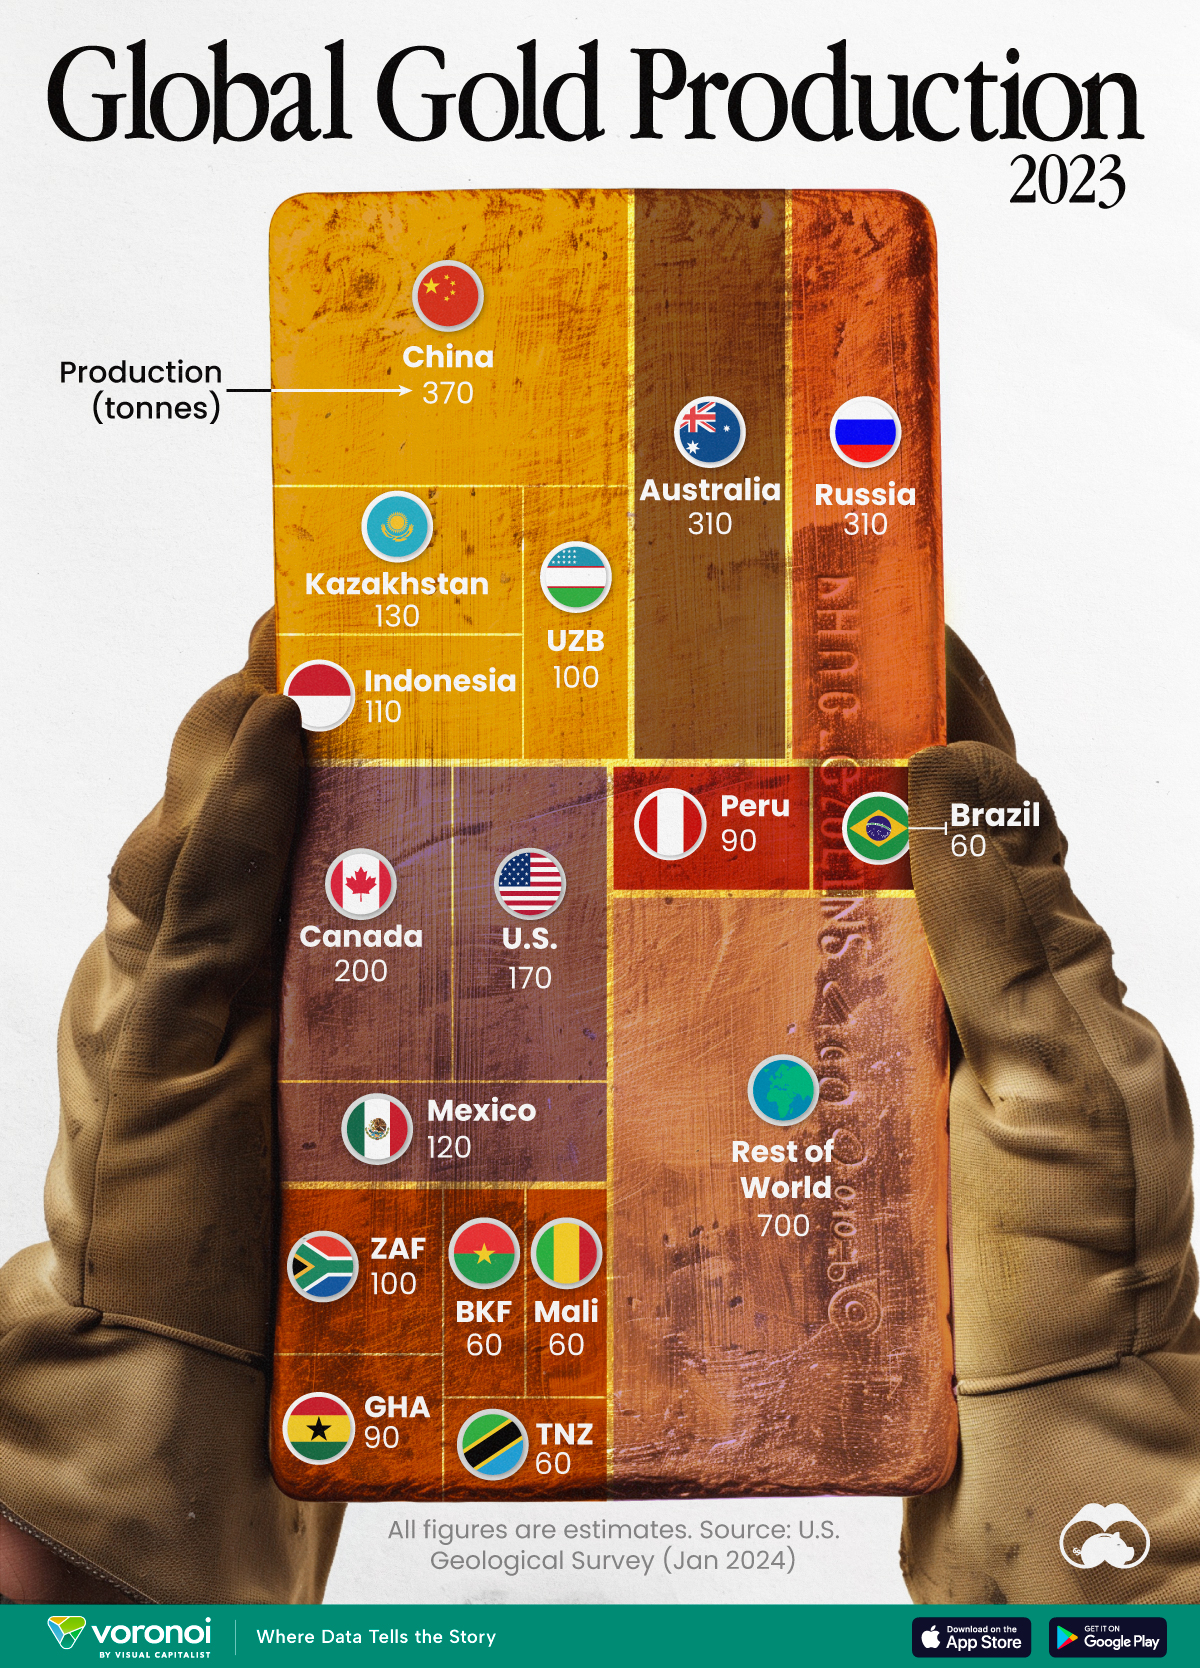
Visualizing Global Gold Production in 2023
Gold production in 2023 was led by China, Australia, and Russia, with each outputting over 300 tonnes.
Visualizing Global Gold Production in 2023
This was originally posted on our Voronoi app. Download the app for free on iOS or Android and discover incredible data-driven charts from a variety of trusted sources.
Over 3,000 tonnes of gold were produced globally in 2023.
In this graphic, we list the world’s leading countries in terms of gold production. These figures come from the latest USGS publication on gold statistics (published January 2024).
China, Australia, and Russia Produced the Most Gold in 2023
China was the top producer in 2023, responsible for over 12% of total global production, followed by Australia and Russia.
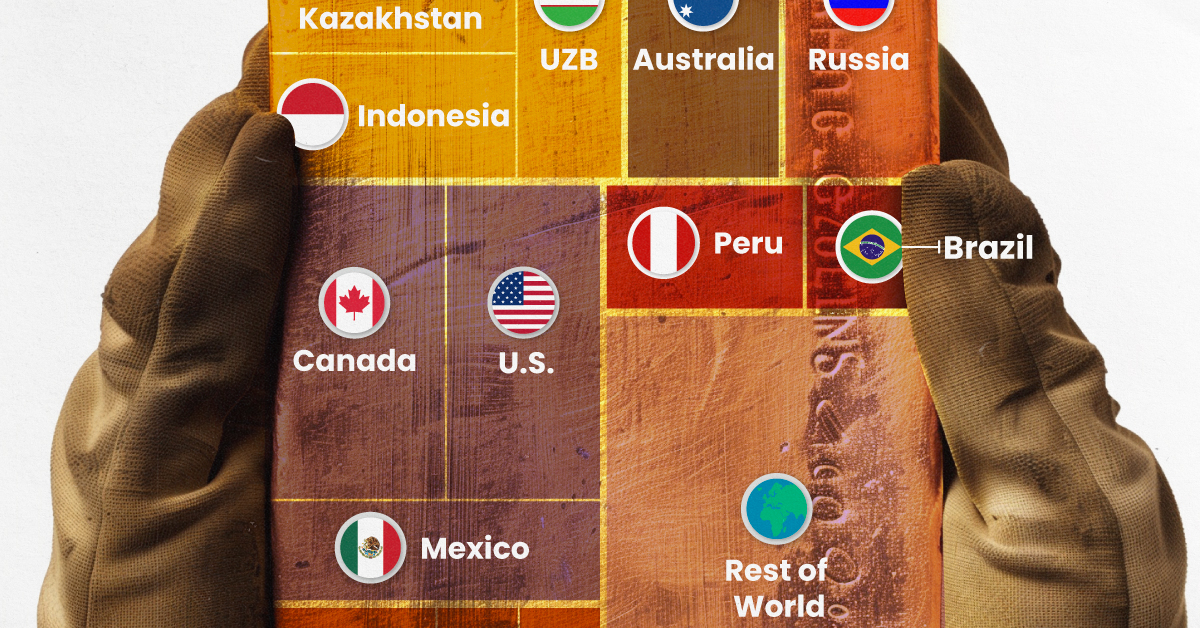
| Country | Region | 2023E Production (tonnes) |
|---|---|---|
| 🇨🇳 China | Asia | 370 |
| 🇦🇺 Australia | Oceania | 310 |
| 🇷🇺 Russia | Europe | 310 |
| 🇨🇦 Canada | North America | 200 |
| 🇺🇸 United States | North America | 170 |
| 🇰🇿 Kazakhstan | Asia | 130 |
| 🇲🇽 Mexico | North America | 120 |
| 🇮🇩 Indonesia | Asia | 110 |
| 🇿🇦 South Africa | Africa | 100 |
| 🇺🇿 Uzbekistan | Asia | 100 |
| 🇬🇭 Ghana | Africa | 90 |
| 🇵🇪 Peru | South America | 90 |
| 🇧🇷 Brazil | South America | 60 |
| 🇧🇫 Burkina Faso | Africa | 60 |
| 🇲🇱 Mali | Africa | 60 |
| 🇹🇿 Tanzania | Africa | 60 |
| 🌍 Rest of World | - | 700 |
Gold mines in China are primarily concentrated in eastern provinces such as Shandong, Henan, Fujian, and Liaoning. As of January 2024, China’s gold mine reserves stand at an estimated 3,000 tonnes, representing around 5% of the global total of 59,000 tonnes.
In addition to being the top producer, China emerged as the largest buyer of the yellow metal for the year. In fact, the country’s central bank alone bought 225 tonnes of gold in 2023, according the World Gold Council.
Estimated Global Gold Consumption
Most of the gold produced in 2023 was used in jewelry production, while another significant portion was sold as a store of value, such as in gold bars or coins.
- Jewelry: 46%
- Central Banks and Institutions: 23%
- Physical Bars: 16%
- Official Coins, Medals, and Imitation Coins: 9%
- Electrical and Electronics: 5%
- Other: 1%
According to Fitch Solutions, over the medium term (2023-2032), global gold mine production is expected to grow 15%, as high prices encourage investment and output.

-

 Wealth6 days ago
Charted: Which City Has the Most Billionaires in 2024?
-

 Mining2 weeks ago
Gold vs. S&P 500: Which Has Grown More Over Five Years?
-

 Uranium2 weeks ago
The World’s Biggest Nuclear Energy Producers
-

 Education2 weeks ago
How Hard Is It to Get Into an Ivy League School?
-

 Debt2 weeks ago
How Debt-to-GDP Ratios Have Changed Since 2000
-

 Sports2 weeks ago
The Highest Earning Athletes in Seven Professional Sports
-

 Science2 weeks ago
Visualizing the Average Lifespans of Mammals
-

 Brands1 week ago
How Tech Logos Have Evolved Over Time