Technology
Chinese Brands are Shaking Up the $420B Smartphone Market
Smartphones are a ubiquitous part of modern life, and now nearly half of humanity is connected through such devices.
As a result, the stakes have never been higher in the ultra-competitive smartphone market. Every day, companies are duking it out for any sliver they can get of global smartphone sales, which now exceed $420 billion per year.
In rapidly growing markets like China and India, the competitive environments are even more interesting. Due to rising socioeconomic circumstances and falling price points on certain models, large segments of these populations are able to purchase these devices for the first time.
These big markets are in a constant state of flux – and it’s not unusual to see top competition to get unseated.
The Chinese Smartphone Market
In the most recent quarter, Chinese smartphone shipments grew a staggering 18.7% to 135.7 million:
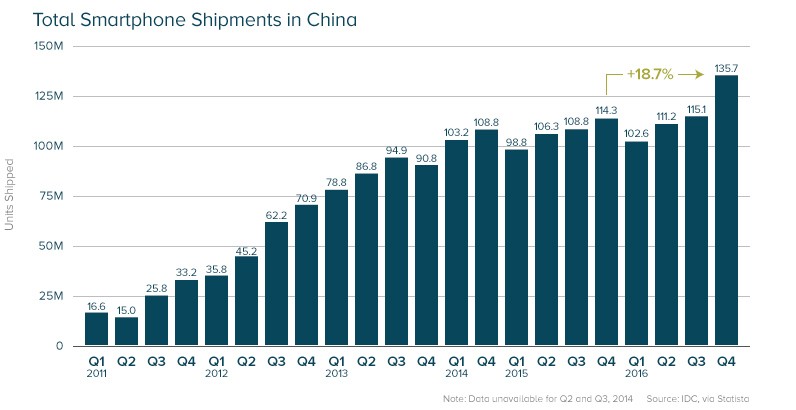
This rapid increase in sales comes at a time when domestic brands in China are starting to aggressively market their products.
Oppo, a brand mostly unknown across the Pacific Ocean, has more than tripled market share over the last year to unseat the incumbent Huawei. This marks the first time that Oppo has been the most popular brand in the country.
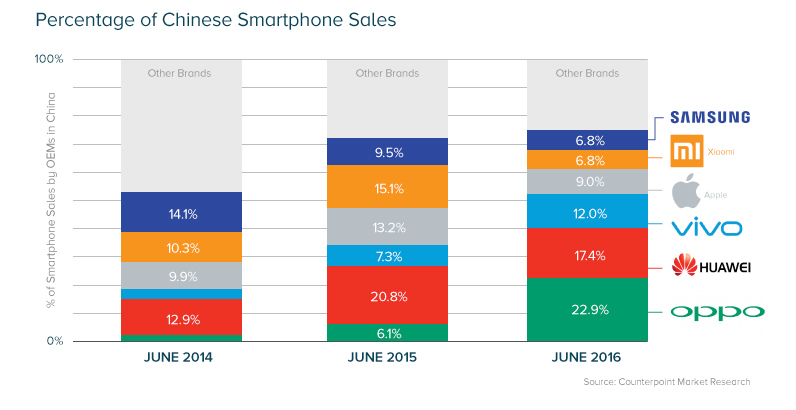
Oppo has adopted a simple but effective strategy, going after the offline market which still contributes more than 70% of total sales in China. Aggressive marketing, promotions and sponsorships, greater offline retail penetration beyond tier-2 and tier-3 cities, better retail margins, dealer support and above all head-turning, innovative smartphone designs has helped Oppo drive its sales in the last eighteen months.
– Neil Shah, Counterpoint Research
iPhone Sales Dip
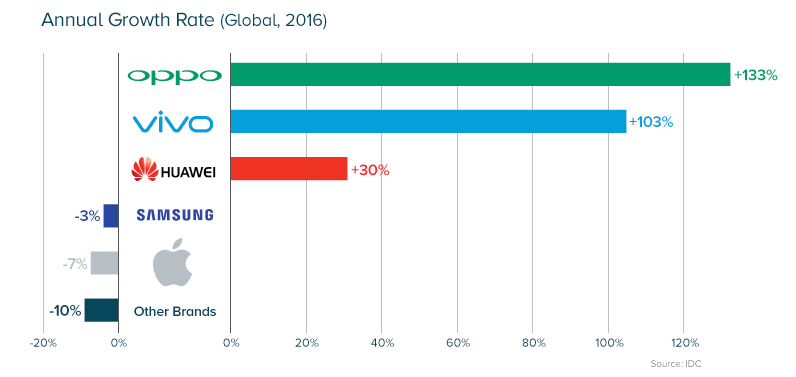
Apple fell in the rankings, as consumers wait for the release of the 10th anniversary iPhone. Notably, this year-over-year decline was the first for Apple since entering the Chinese market.
Because domestic companies have greater access to manufacturers, they are beginning to roll out new features (e.g. augmented reality, flexible screens) to compete with brands like Samsung and Apple in ways never seen before. Domestic Chinese brands are generating excitement for their products and that is translating into triple-digit growth numbers for companies like Oppo and Vivo.
One thing is for certain: competition will continue to be fierce in the world’s most populous country in 2017, and the success of domestic brands will continue to have growing implications for non-Chinese brands.


Digital Transformation
Mapped: The Number of AI Startups By Country
Over the past decade, thousands of AI startups have been funded worldwide. See which countries are leading the charge in this map graphic.
Mapped: The Number of AI Startups By Country
This was originally posted on our Voronoi app. Download the app for free on iOS or Android and discover incredible data-driven charts from a variety of trusted sources.
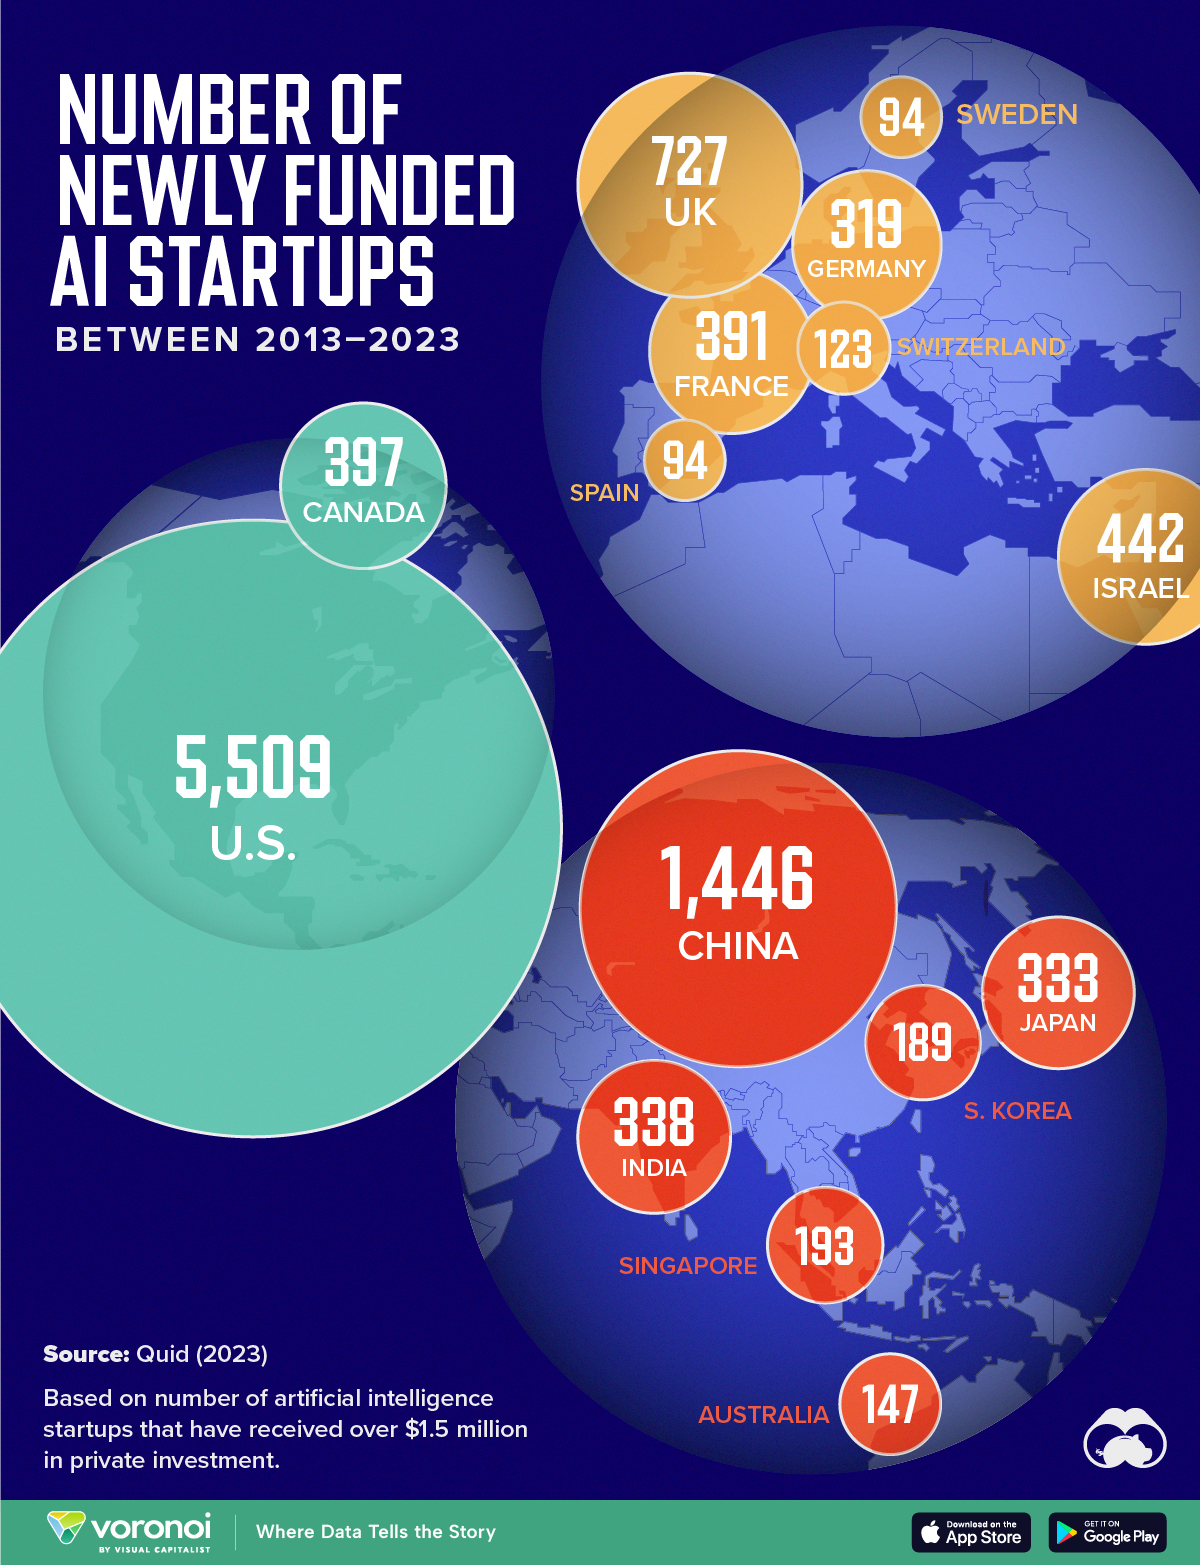
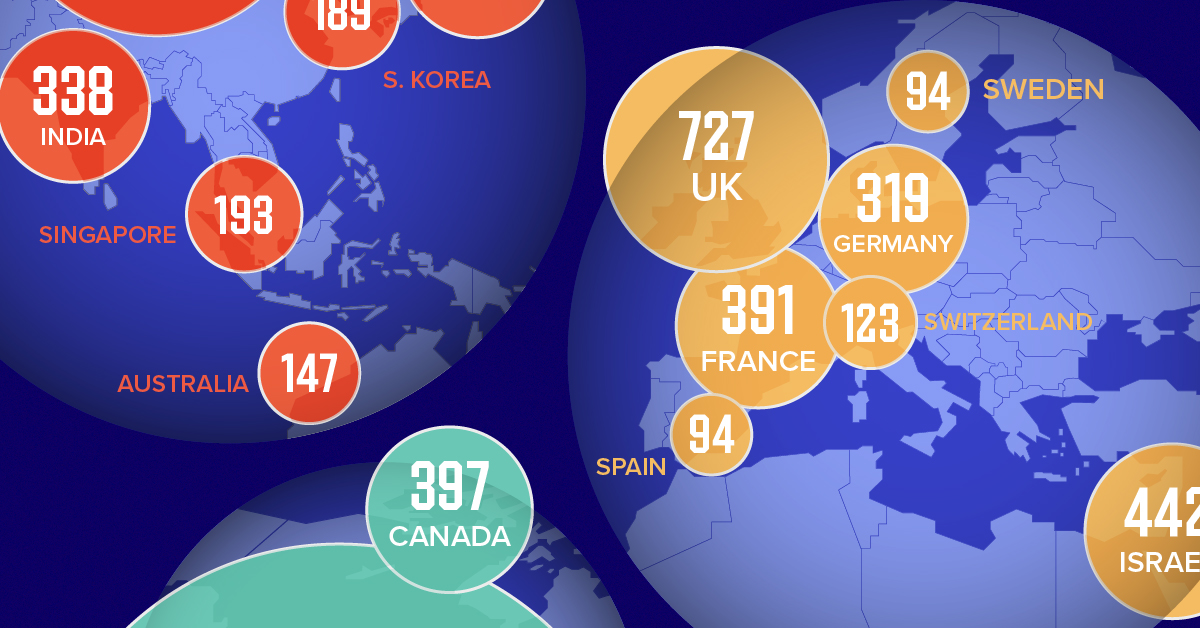
Amidst the recent expansion of artificial intelligence (AI), we’ve visualized data from Quid (accessed via Stanford’s 2024 AI Index Report) to highlight the top 15 countries which have seen the most AI startup activity over the past decade.
The figures in this graphic represent the number of newly funded AI startups within that country, in the time period of 2013 to 2023. Only companies that received over $1.5 million in private investment were considered.
Data and Highlights
The following table lists all of the numbers featured in the above graphic.
| Rank | Geographic area | Number of newly funded AI startups (2013-2023) |
|---|---|---|
| 1 | 🇺🇸 United States | 5,509 |
| 2 | 🇨🇳 China | 1,446 |
| 3 | 🇬🇧 United Kingdom | 727 |
| 4 | 🇮🇱 Israel | 442 |
| 5 | 🇨🇦 Canada | 397 |
| 6 | 🇫🇷 France | 391 |
| 7 | 🇮🇳 India | 338 |
| 8 | 🇯🇵 Japan | 333 |
| 9 | 🇩🇪 Germany | 319 |
| 10 | 🇸🇬 Singapore | 193 |
| 11 | 🇰🇷 South Korea | 189 |
| 12 | 🇦🇺 Australia | 147 |
| 13 | 🇨🇭 Switzerland | 123 |
| 14 | 🇸🇪 Sweden | 94 |
| 15 | 🇪🇸 Spain | 94 |
From this data, we can see that the U.S., China, and UK have established themselves as major hotbeds for AI innovation.
In terms of funding, the U.S. is massively ahead, with private AI investment totaling $335 billion between 2013 to 2023. AI startups in China raised $104 billion over the same timeframe, while those in the UK raised $22 billion.
Further analysis reveals that the U.S. is widening this gap even more. In 2023, for example, private investment in the U.S. grew by 22% from 2022 levels. Meanwhile, investment fell in China (-44%) and the UK (-14.1%) over the same time span.
Where is All This Money Flowing To?
Quid also breaks down total private AI investment by focus area, providing insight into which sectors are receiving the most funding.
| Focus Area | Global Investment in 2023 (USD billions) |
|---|---|
| 🤖 AI infrastructure, research, and governance | $18.3 |
| 🗣️ Natural language processing | $8.1 |
| 📊 Data management | $5.5 |
| ⚕️ Healthcare | $4.2 |
| 🚗 Autonomous vehicles | $2.7 |
| 💰 Fintech | $2.1 |
| ⚛️ Quantum computing | $2.0 |
| 🔌 Semiconductor | $1.7 |
| ⚡ Energy, oil, and gas | $1.5 |
| 🎨 Creative content | $1.3 |
| 📚 Education | $1.2 |
| 📈 Marketing | $1.1 |
| 🛸 Drones | $1.0 |
| 🔒 Cybersecurity | $0.9 |
| 🏭 Manufacturing | $0.9 |
| 🛒 Retail | $0.7 |
| 🕶️ AR/VR | $0.7 |
| 🛡️ Insurtech | $0.6 |
| 🎬 Entertainment | $0.5 |
| 💼 VC | $0.5 |
| 🌾 Agritech | $0.5 |
| ⚖️ Legal tech | $0.4 |
| 👤 Facial recognition | $0.3 |
| 🌐 Geospatial | $0.2 |
| 💪 Fitness and wellness | $0.2 |
Attracting the most money is AI infrastructure, research, and governance, which refers to startups that are building AI applications (like OpenAI’s ChatGPT).
The second biggest focus area is natural language processing (NLP), which is a type of AI that enables computers to understand and interpret human language. This technology has numerous use cases for businesses, particularly in financial services, where NLP can power customer support chatbots and automated wealth advisors.
With $8 billion invested into NLP-focused startups during 2023, investors appear keenly aware of this technology’s transformative potential.
Learn More About AI From Visual Capitalist
If you enjoyed this graphic, be sure to check out Visualizing AI Patents by Country.

-

 Mining6 days ago
Visualizing Global Gold Production in 2023
-

 AI2 weeks ago
Visualizing AI Patents by Country
-

 Markets2 weeks ago
Economic Growth Forecasts for G7 and BRICS Countries in 2024
-

 Wealth2 weeks ago
Charted: Which City Has the Most Billionaires in 2024?
-

 Technology2 weeks ago
All of the Grants Given by the U.S. CHIPS Act
-

 Green1 week ago
The Carbon Footprint of Major Travel Methods
-

 United States1 week ago
Visualizing the Most Common Pets in the U.S.
-

 Culture1 week ago
The World’s Top Media Franchises by All-Time Revenue