Markets
How Much State Debt Rests on Your Shoulders?
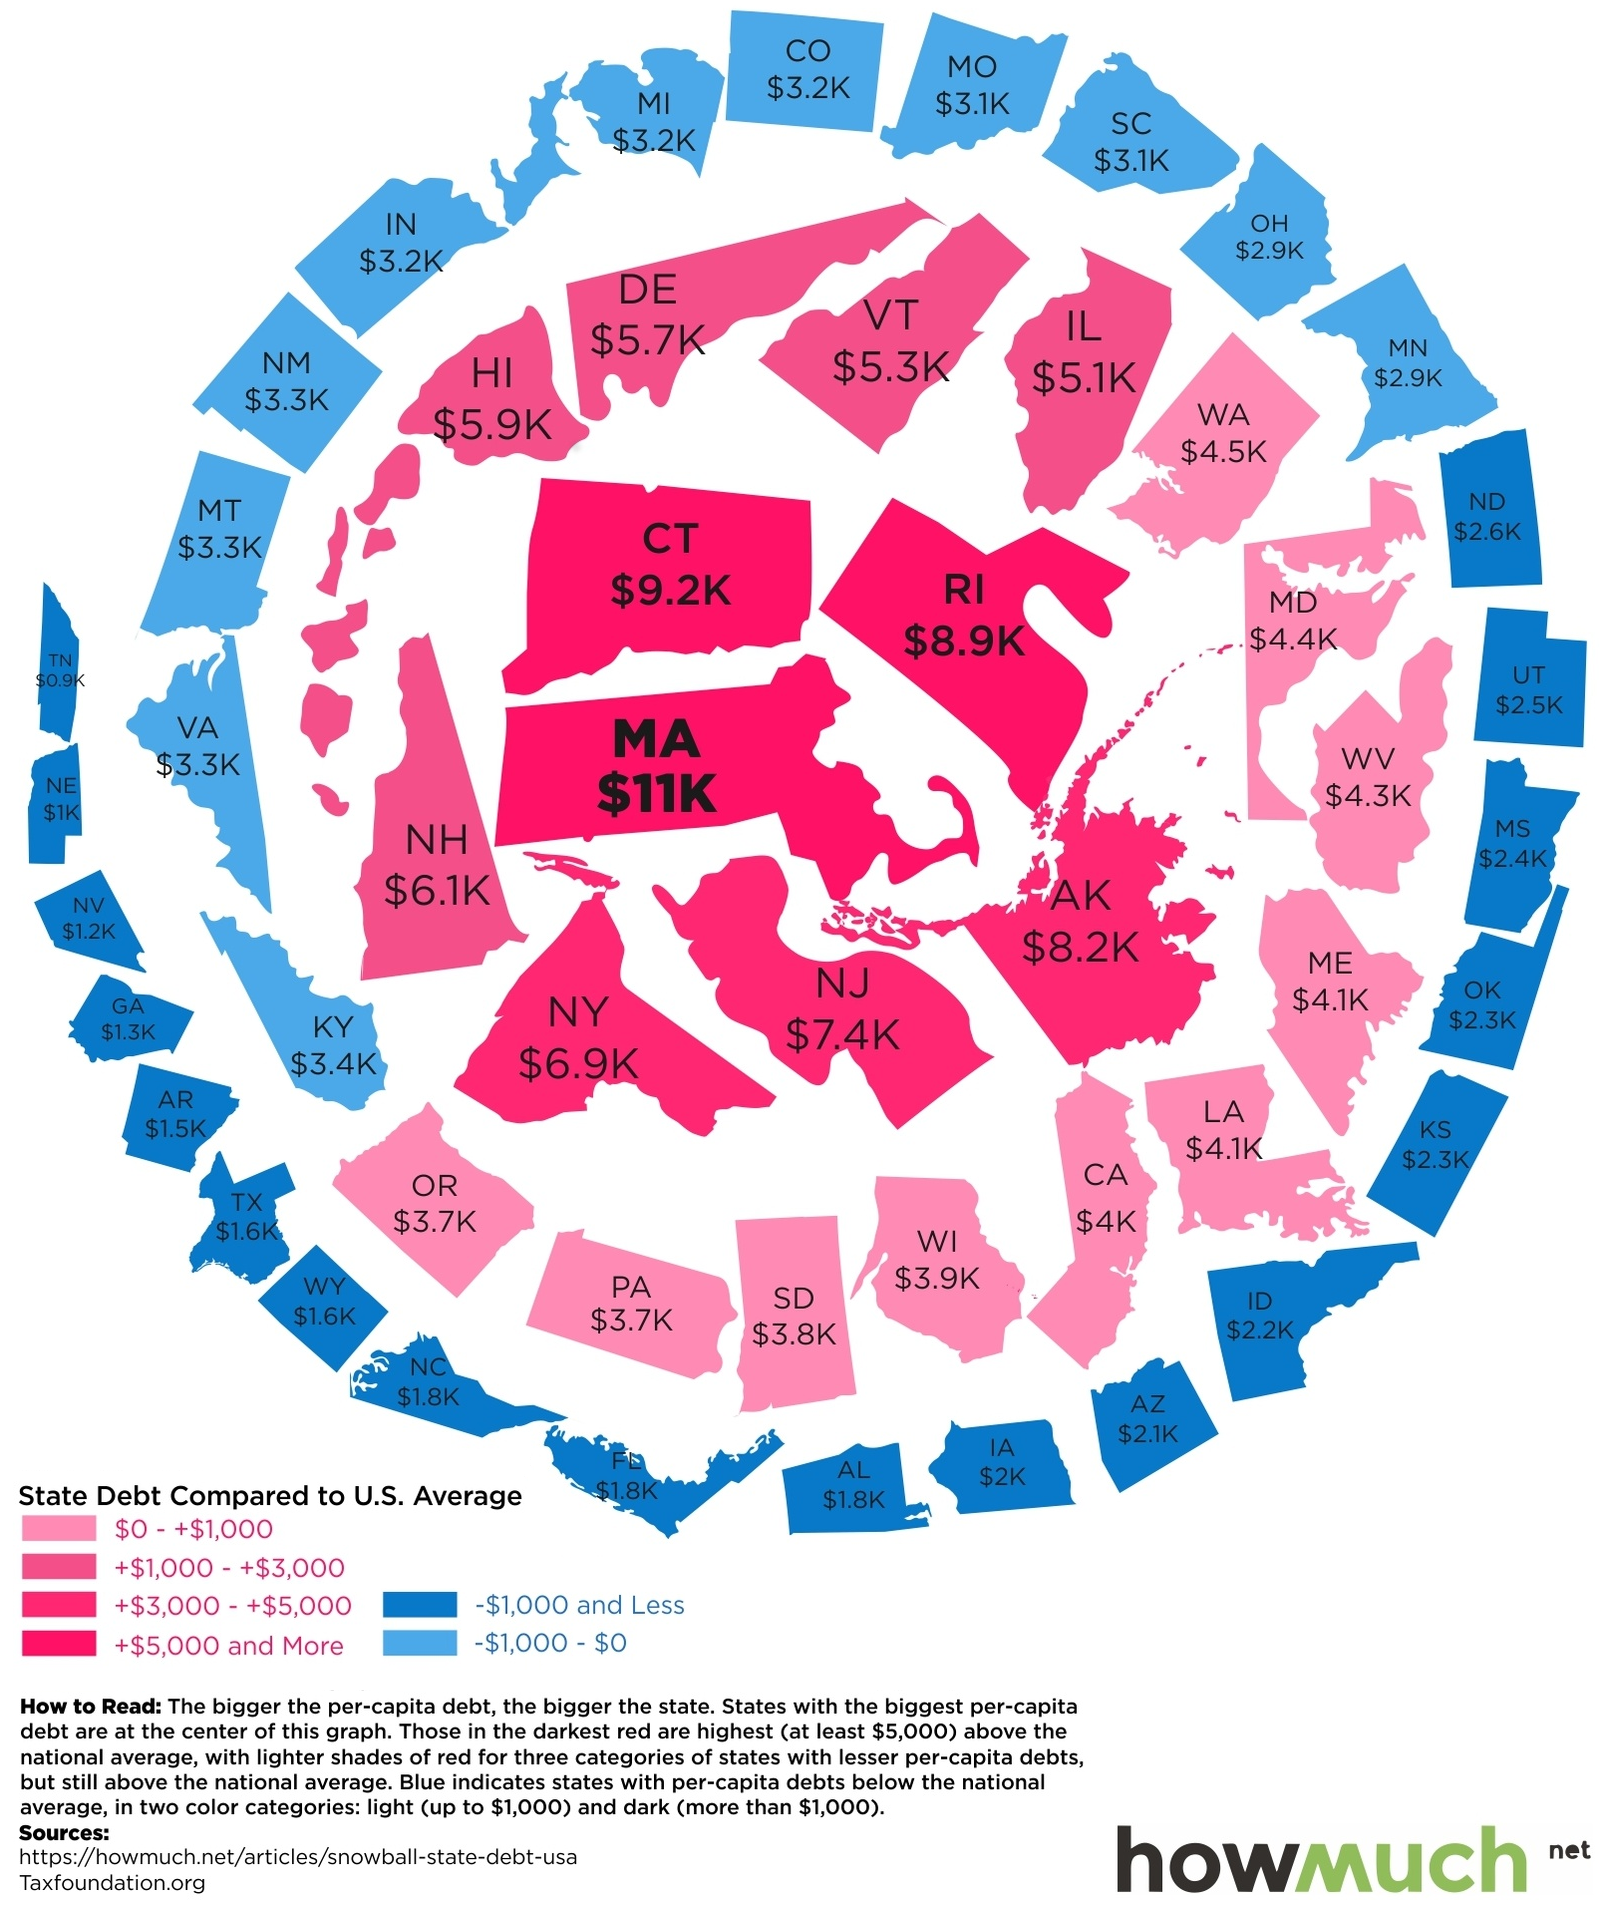
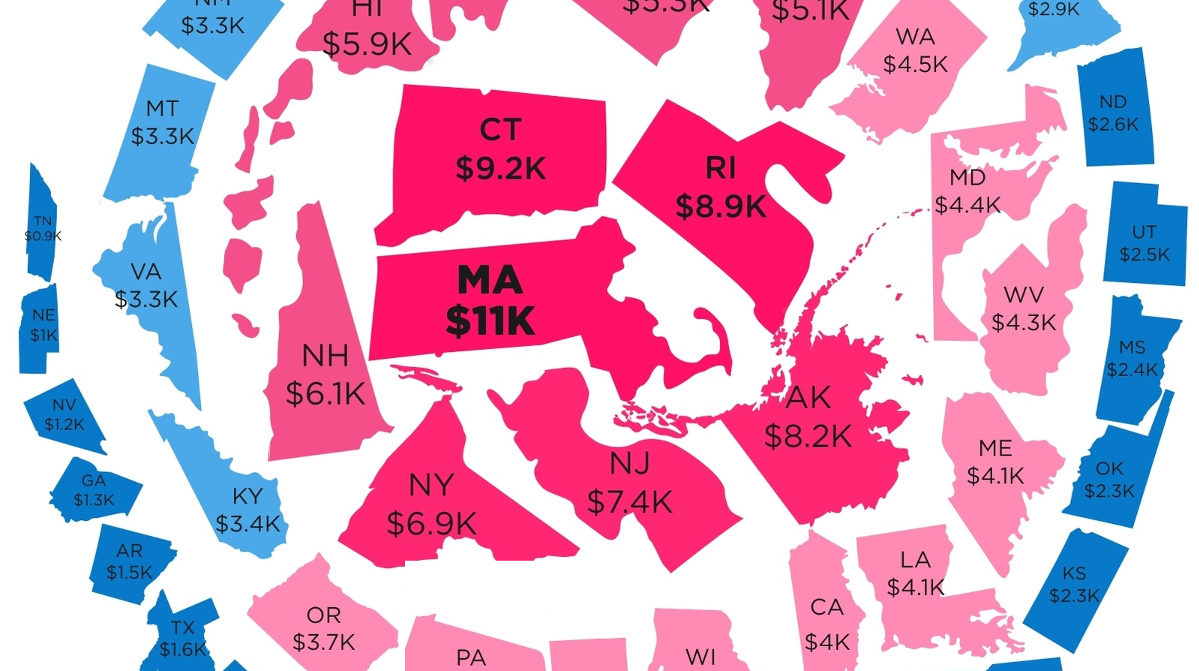
The following “snowball” shows state debt per person in each state:
How Much State Debt Rests on Your Shoulders?
We’ve previously shown the federal government debt incurred per person in each country, but today’s infographic drills down to the state level.
How much state debt is there per person, and why is there such a wide discrepancy between states like Massachusetts ($11,000 per person) and Nebraska ($1,000 per person)?
The Snowball of State Debt
Today’s infographic from HowMuch.net, a cost information site, organizes states by debt per capita using a snowball-like effect.
The five states at the center of the snowball with the highest debt per capita are Massachusetts ($11,000), Connecticut ($9,200), Rhode Island ($8,900), Alaska ($8,200), and New Jersey ($7,400).
On the other end of the spectrum are the five states with the lowest state debt per capita: Tennessee ($900), Nebraska ($1,000), Nevada ($1,200), Georgia ($1,300), and Arkansas ($1,500).
While it is reasonable to expect big differences in debt per capita between countries, seeing an interstate difference of up to 10x per person seems a bit perplexing at face value. Let’s see if we can dig a little deeper on what accounts for these differences.
The Curious Case of Massachusetts
Currently, Massachusetts holds the title of the highest state debt per capita, as well as ranking #2 in terms of state debt as a percentage of GDP (14.0%). It’s also worth noting that debt analysts at S&P have recently lowered the outlook on state bonds from stable to negative.
Meanwhile, The Mercatus Center ranked Massachusetts in 49th place in their 2016 State Fiscal Rankings. (The only state to fare worse was Connecticut.)
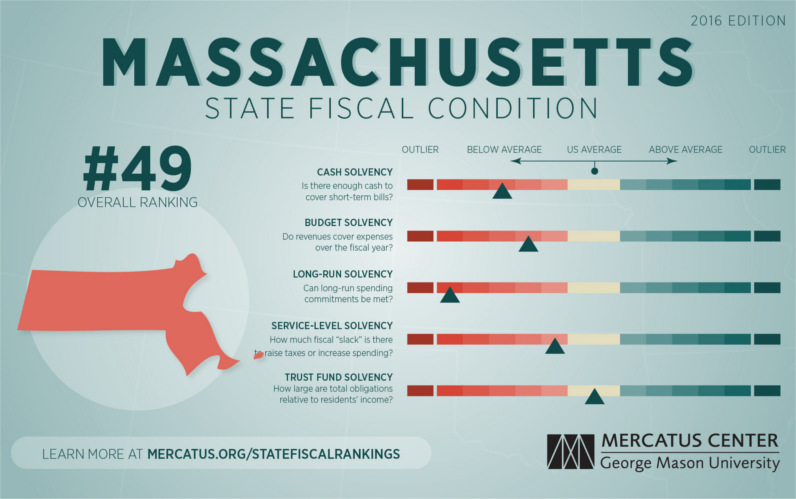
Like other old and urban states, Massachusetts requires significant investments to repair aging roads, schools, and other infrastructure. For many fiscal analysts, however, it is the gap in unfunded liabilities that is the long-term concern.
Forbes notes that unfunded liabilities from public pensions are probably the biggest fiscal problem facing state governments today, and Massachusetts is no exception. Unfunded liabilities in the state are pegged at $94.45 billion with other postemployment benefits (OPEB) at $15.38 billion, and eventually these are issues that will have to be dealt with.
Healthier Budgets
What does a healthier state budget look like? The best examples can be found in the Midwest.
Here’s Nebraska, which has about $1,000 of debt per person:
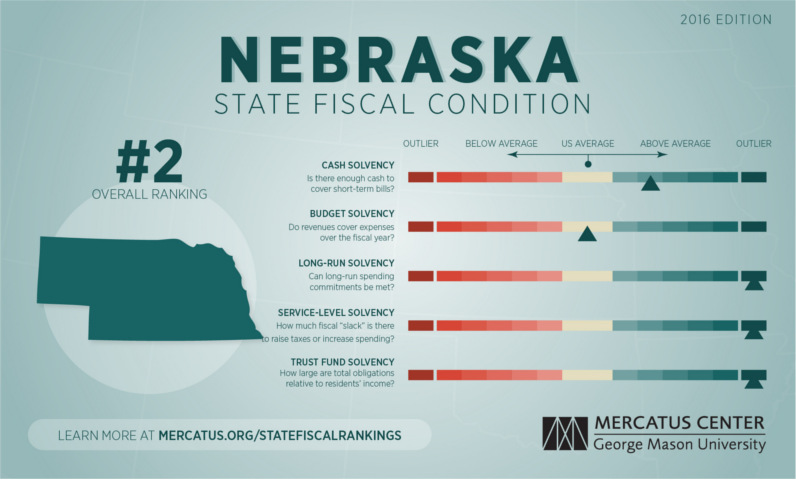
Nebraska exhibits strong fiscal health across all categories. On a cash basis, Nebraska has between 3.81 and 5.02 times the cash needed to cover short-term liabilities. Revenues exceed expenses by 7 percent, producing a surplus of $294 per capita.
– Mercatus Center at George Mason University


Markets
U.S. Debt Interest Payments Reach $1 Trillion
U.S. debt interest payments have surged past the $1 trillion dollar mark, amid high interest rates and an ever-expanding debt burden.


U.S. Debt Interest Payments Reach $1 Trillion
This was originally posted on our Voronoi app. Download the app for free on iOS or Android and discover incredible data-driven charts from a variety of trusted sources.
The cost of paying for America’s national debt crossed the $1 trillion dollar mark in 2023, driven by high interest rates and a record $34 trillion mountain of debt.
Over the last decade, U.S. debt interest payments have more than doubled amid vast government spending during the pandemic crisis. As debt payments continue to soar, the Congressional Budget Office (CBO) reported that debt servicing costs surpassed defense spending for the first time ever this year.
This graphic shows the sharp rise in U.S. debt payments, based on data from the Federal Reserve.
A $1 Trillion Interest Bill, and Growing
Below, we show how U.S. debt interest payments have risen at a faster pace than at another time in modern history:
| Date | Interest Payments | U.S. National Debt |
|---|---|---|
| 2023 | $1.0T | $34.0T |
| 2022 | $830B | $31.4T |
| 2021 | $612B | $29.6T |
| 2020 | $518B | $27.7T |
| 2019 | $564B | $23.2T |
| 2018 | $571B | $22.0T |
| 2017 | $493B | $20.5T |
| 2016 | $460B | $20.0T |
| 2015 | $435B | $18.9T |
| 2014 | $442B | $18.1T |
| 2013 | $425B | $17.2T |
| 2012 | $417B | $16.4T |
| 2011 | $433B | $15.2T |
| 2010 | $400B | $14.0T |
| 2009 | $354B | $12.3T |
| 2008 | $380B | $10.7T |
| 2007 | $414B | $9.2T |
| 2006 | $387B | $8.7T |
| 2005 | $355B | $8.2T |
| 2004 | $318B | $7.6T |
| 2003 | $294B | $7.0T |
| 2002 | $298B | $6.4T |
| 2001 | $318B | $5.9T |
| 2000 | $353B | $5.7T |
| 1999 | $353B | $5.8T |
| 1998 | $360B | $5.6T |
| 1997 | $368B | $5.5T |
| 1996 | $362B | $5.3T |
| 1995 | $357B | $5.0T |
| 1994 | $334B | $4.8T |
| 1993 | $311B | $4.5T |
| 1992 | $306B | $4.2T |
| 1991 | $308B | $3.8T |
| 1990 | $298B | $3.4T |
| 1989 | $275B | $3.0T |
| 1988 | $254B | $2.7T |
| 1987 | $240B | $2.4T |
| 1986 | $225B | $2.2T |
| 1985 | $219B | $1.9T |
| 1984 | $205B | $1.7T |
| 1983 | $176B | $1.4T |
| 1982 | $157B | $1.2T |
| 1981 | $142B | $1.0T |
| 1980 | $113B | $930.2B |
| 1979 | $96B | $845.1B |
| 1978 | $84B | $789.2B |
| 1977 | $69B | $718.9B |
| 1976 | $61B | $653.5B |
| 1975 | $55B | $576.6B |
| 1974 | $50B | $492.7B |
| 1973 | $45B | $469.1B |
| 1972 | $39B | $448.5B |
| 1971 | $36B | $424.1B |
| 1970 | $35B | $389.2B |
| 1969 | $30B | $368.2B |
| 1968 | $25B | $358.0B |
| 1967 | $23B | $344.7B |
| 1966 | $21B | $329.3B |
Interest payments represent seasonally adjusted annual rate at the end of Q4.
At current rates, the U.S. national debt is growing by a remarkable $1 trillion about every 100 days, equal to roughly $3.6 trillion per year.
As the national debt has ballooned, debt payments even exceeded Medicaid outlays in 2023—one of the government’s largest expenditures. On average, the U.S. spent more than $2 billion per day on interest costs last year. Going further, the U.S. government is projected to spend a historic $12.4 trillion on interest payments over the next decade, averaging about $37,100 per American.
Exacerbating matters is that the U.S. is running a steep deficit, which stood at $1.1 trillion for the first six months of fiscal 2024. This has accelerated due to the 43% increase in debt servicing costs along with a $31 billion dollar increase in defense spending from a year earlier. Additionally, a $30 billion increase in funding for the Federal Deposit Insurance Corporation in light of the regional banking crisis last year was a major contributor to the deficit increase.
Overall, the CBO forecasts that roughly 75% of the federal deficit’s increase will be due to interest costs by 2034.

-

 Green2 weeks ago
Ranked: Top Countries by Total Forest Loss Since 2001
-

 Travel1 week ago
Ranked: The World’s Top Flight Routes, by Revenue
-

 Technology1 week ago
Ranked: Semiconductor Companies by Industry Revenue Share
-

 Money2 weeks ago
Which States Have the Highest Minimum Wage in America?
-

 Real Estate2 weeks ago
Ranked: The Most Valuable Housing Markets in America
-

 Markets2 weeks ago
Charted: Big Four Market Share by S&P 500 Audits
-

 AI2 weeks ago
The Stock Performance of U.S. Chipmakers So Far in 2024
-

 Automotive2 weeks ago
Almost Every EV Stock is Down After Q1 2024