Markets
Charted: Big Four Market Share by S&P 500 Audits
![]() See this visualization first on the Voronoi app.
See this visualization first on the Voronoi app.
Charted: Big Four Market Share by S&P 500 Audits
This was originally posted on our Voronoi app. Download the app for free on Apple or Android and discover incredible data-driven charts from a variety of trusted sources.
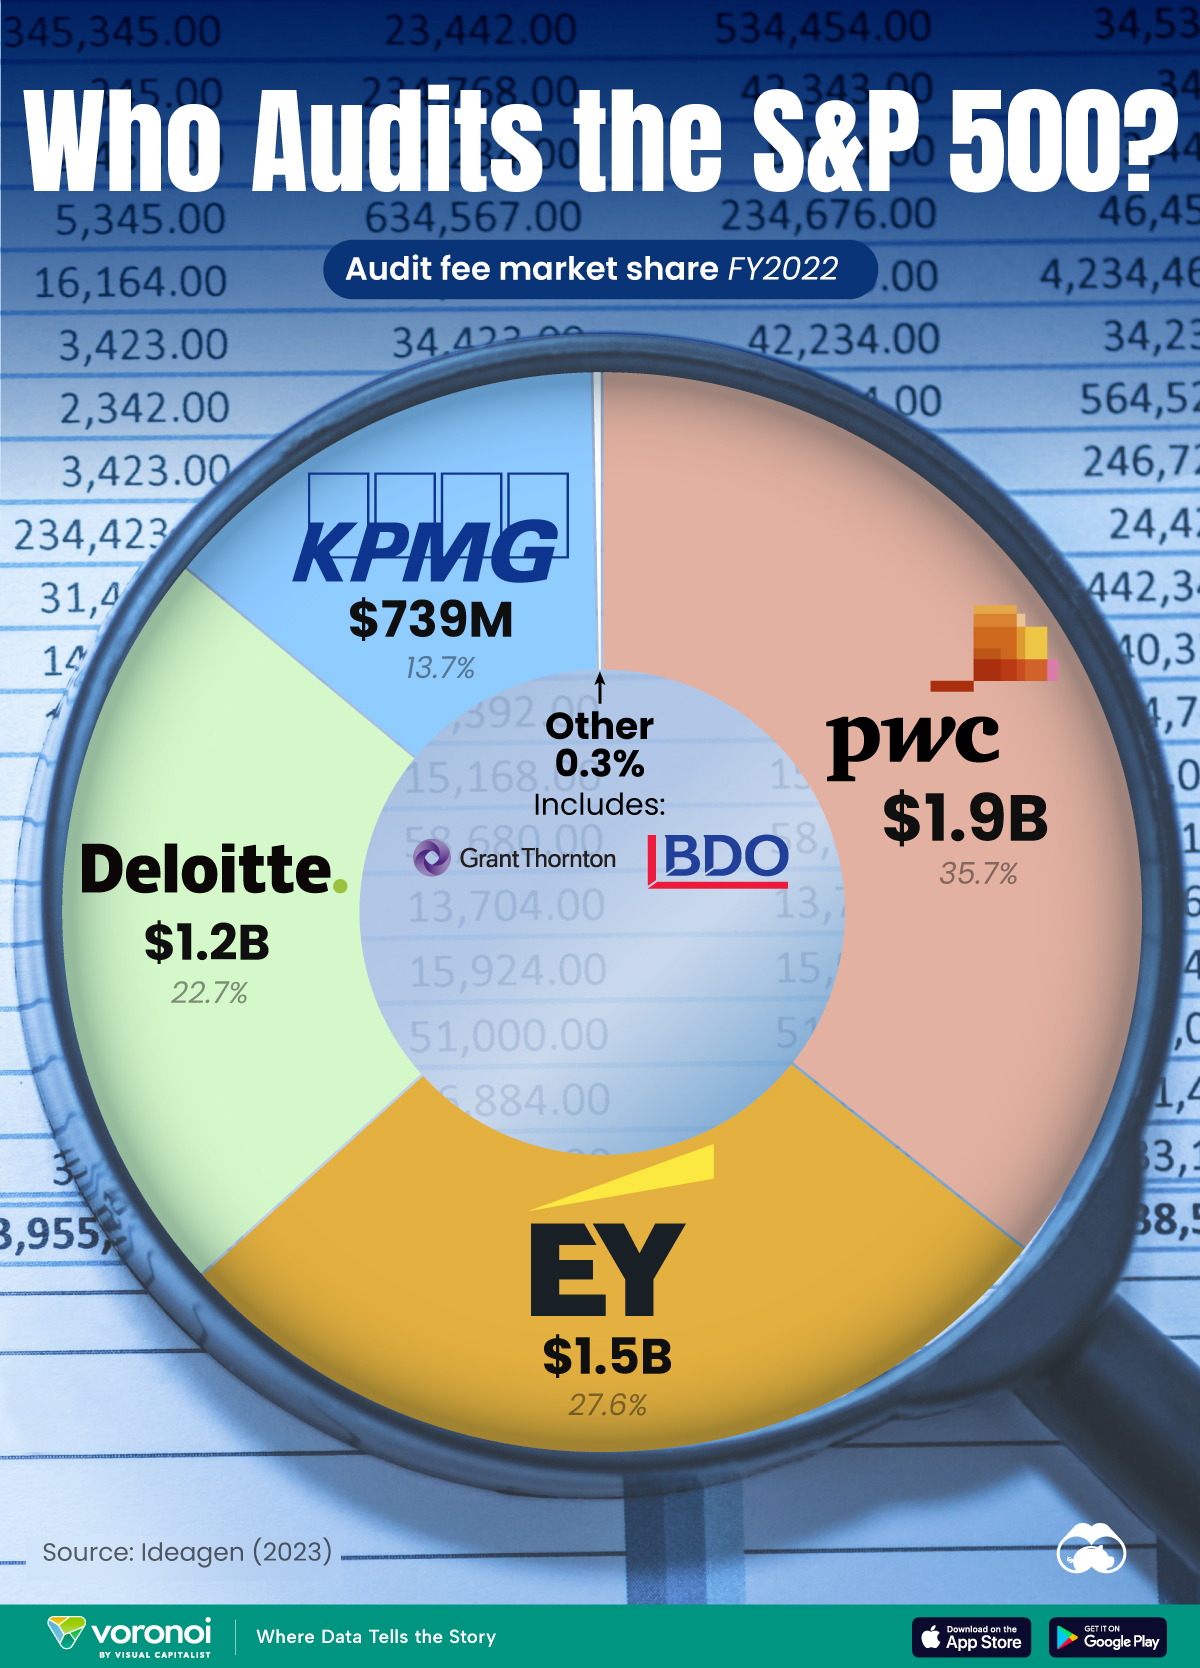
The companies on the S&P 500 together paid $5.3 billion in audit fees in fiscal year (FY) 2022. But which accounting firm took home the lion’s share of that windfall?
To find out, we visualized the Big Four’s market share of S&P 500 audits using data published by Ideagen in August 2023.
Who Audits the S&P 500?
PricewaterhouseCoopers claims the largest share of S&P 500 companies’ audit fees, at a massive $1.9 billion. Given the firm’s 152 clients among the index, this translates to roughly $12.6 million in revenue per relationship.
| Rank | Company | Audit Fees from S&P 500 | Market Share |
|---|---|---|---|
| 1 | PwC | $1.9B | 35.7% |
| 2 | EY | $1.5B | 27.6% |
| 3 | Deloitte | $1.2B | 22.7% |
| 4 | KPMG | $739M | 13.7% |
| N/A | Other | $15M | 0.3% |
Ernst & Young ($1.5 billion) and Deloitte ($1.2 billion) rank second and third, with KPMG a distant fourth at $739 million.
KPMG is generally considered the laggard of the Big Four accounting firms, and has faced more challenging times in the last few years. For instance, it was the auditor of the three U.S. banks that failed in 2023.
And in 2020, the firm had the worst report card of the Big Four, with only 61% of its sampled audits meeting industry standards.
Nevertheless the Big Four still maintain an ironclad grip on the general auditing business. Grant Thornton and BDO USA, the two other firms that audited the index, together only managed about $15 million in fees.
Which S&P 500 Companies Pay the Most Audit Fees?
Ideagen found that Manufacturing and Finance sectors paid the most audit fees, comprising nearly 69% of the $5.3 billion total paid by the index.
| Rank | S&P 500 Sector | Market Share | Audit Fees (FY22) |
|---|---|---|---|
| 1 | 🏭 Manufacturing | 43.4% | $2.2B |
| 2 | 💼 Finance | 25.2% | $1.4B |
| 3 | 📞 Services | 11.8% | $635M |
| 4 | 🚚 Transport & Communication | 11.0% | $592M |
| 5 | 🛒 Retail Trade | 4.0% | $215M |
| 6 | 📦 Wholesale Trade | 2.3% | $124M |
| 7 | ⛏️ Mining | 1.6% | $86M |
| 8 | 🔨 Construction | 0.5% | $27M |
| 9 | 🌾 Agriculture | 0.2% | $11M |
General Electric led the manufacturing sector, disbursing $57.6 million for audit services during FY22. Meanwhile, Goldman Sachs topped the finance sector, spending $78.1 million on audit fees.


Markets
Visualizing Berkshire Hathaway’s Stock Portfolio (Q1 2024)
We visualized the latest data on Berkshire Hathaway’s portfolio to see what Warren Buffett is invested in.
Visualizing Berkshire Hathaway’s Portfolio as of Q1 2024
This was originally posted on our Voronoi app. Download the app for free on iOS or Android and discover incredible data-driven charts from a variety of trusted sources.
Wondering what the Oracle of Omaha has his money invested in?
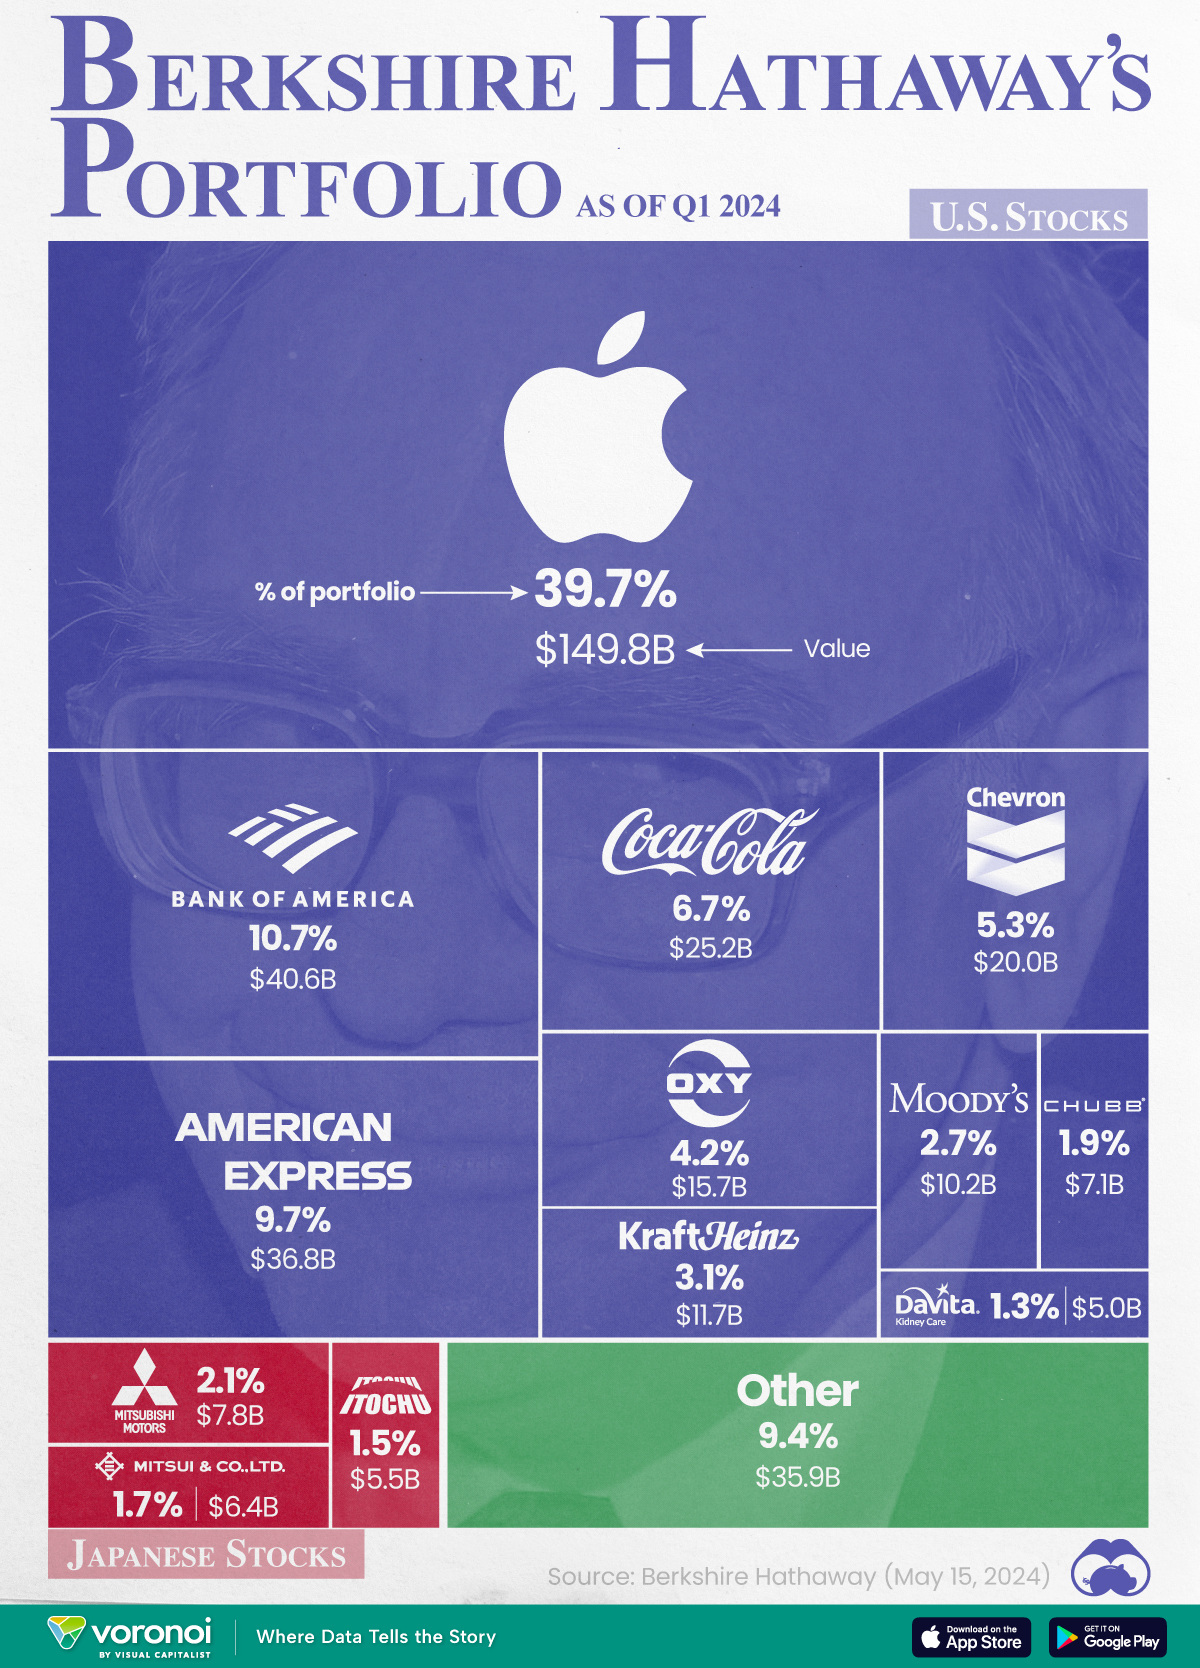
In this graphic, we illustrate Berkshire Hathaway’s portfolio holdings, as of Q1 2024. This data was released on May 15, 2024, and can be easily accessed via CNBC’s Berkshire Hathaway Portfolio Tracker.
The value of each position listed in this graphic is based on market prices as of May 23, 2024, and will change over time.
Furthermore, note that Berkshire has received SEC permission to temporarily withhold data on certain positions. This includes all of its Japanese stocks, which are reported as of June 12, 2023.
It’s (almost) all Apple
The data we used to create this graphic can be found in the following table. Positions worth less than $5 billion were included in “Other”.
| Company | % of Portfolio | Value (As of 05-23-2024) |
|---|---|---|
| 🇺🇸 Apple Inc | 39.7 | $149.8B |
| 🇺🇸 Bank of America | 10.7 | $40.6B |
| 🇺🇸 American Express | 9.7 | $36.8B |
| 🇺🇸 Coca-Cola | 6.7 | $25.2B |
| 🇺🇸 Chevron | 5.3 | $20.0B |
| 🇺🇸 Occidental Petroleum | 4.2 | $15.7B |
| 🇺🇸 Kraft Heinz | 3.1 | $11.7B |
| 🇺🇸 Moody’s | 2.7 | $10.2B |
| 🇯🇵 Mitsubishi Corp | 2.1 | $7.8B |
| 🇺🇸 Chubb | 1.9 | $7.1B |
| 🇯🇵 Mitsui & Co | 1.7 | $6.4B |
| 🇯🇵 Itochu Corporation | 1.5 | $5.5B |
| 🇺🇸 DaVita | 1.3 | $5.0B |
| 🌍 Other | 9.4 | $35.9B |
| Total | 100 | $377.9B |
From this, we can see that Berkshire’s largest position is Apple, which makes up almost 40% of the portfolio and is worth nearly $150 billion.
While Warren Buffett once referred to Apple as the best business in the world, his firm actually trimmed its position by 13% in Q1 2024.
Even after that cut, Berkshire still maintains a 5.1% ownership stake in Apple.
Why Japanese Stocks?
While most of Berkshire’s major positions are in American companies, Japanese firms make up a significant chunk.
In 2020, Berkshire took positions in five Japanese trading houses: Itochu, Marubeni, Mitsubishi, Mitsui, and Sumitomo.
Also known as sōgō shōsha, which translates to “general trading company”, these firms are highly diversified across major industries.
According to an article from IMD, Buffett sees an attractive opportunity in Japan due to the country’s low-interest rates, among other things.
Learn More About Investing From Visual Capitalist
If you enjoyed this graphic, be sure to check out Visualizing the Growth of $100, by Asset Class (1970-2023).

-

 United States2 weeks ago
Comparing New and Current U.S. Tariffs on Chinese Imports
-

 Mining2 weeks ago
Visualizing Copper Production by Country in 2023
-

 Brands2 weeks ago
How Popular Snack Brand Logos Have Changed
-

 War2 weeks ago
Visualized: Aircraft Carriers by Country
-

 Cannabis2 weeks ago
Mapped: Countries Where Recreational Cannabis is Legal
-

 Brands2 weeks ago
Charted: How the Logos of Select Fashion Brands Have Evolved
-

 Urbanization2 weeks ago
Mapped: U.S. States By Number of Cities Over 250,000 Residents
-
 Crime2 weeks ago
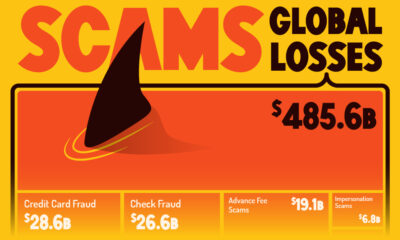
Visualizing Global Losses from Financial Scams