Energy
Visualizing the Range of Electric Cars vs. Gas-Powered Cars
![]() Subscribe to the Elements free mailing list for more like this
Subscribe to the Elements free mailing list for more like this

The Range of Electric Cars vs. Gas-Powered Cars
This was originally posted on Elements. Sign up to the free mailing list to get beautiful visualizations on natural resource megatrends in your email every week.
EV adoption has grown rapidly in recent years, but many prospective buyers still have doubts about electric car ranges.
In fact, 33% of new car buyers chose range anxiety—the concern about how far an EV can drive on a full charge—as their top inhibitor to purchasing electric cars in a survey conducted by EY.
So, how far can the average electric car go on one charge, and how does that compare with the typical range of gas-powered cars?
The Rise in EV Ranges
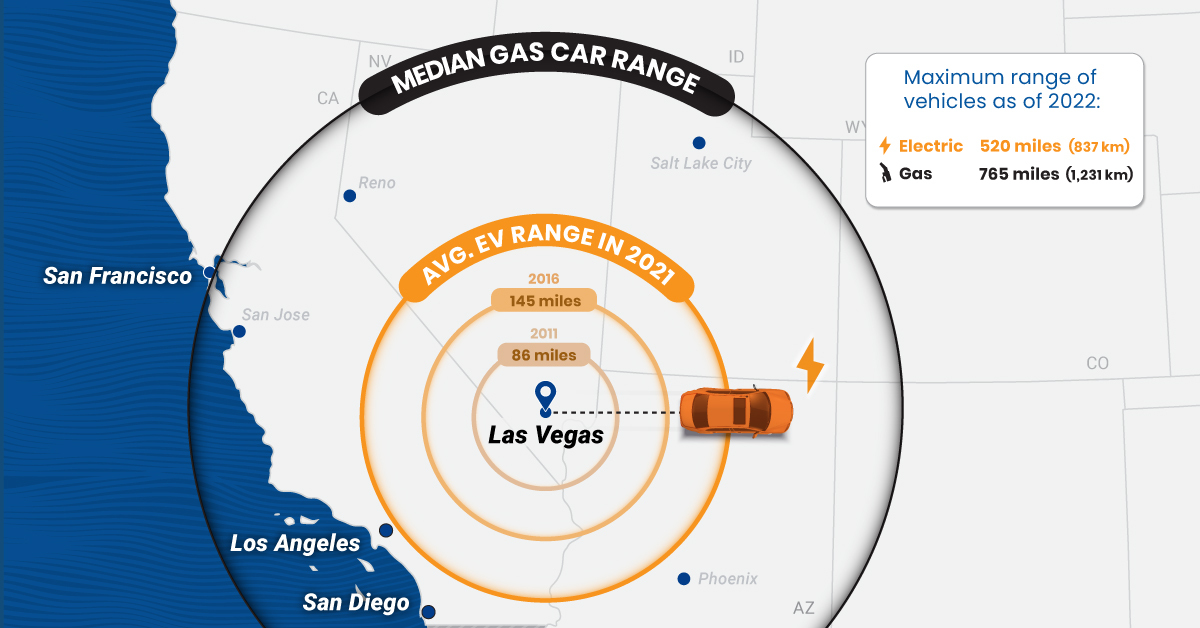
Thanks to improvements in battery technology, the average range of electric cars has more than doubled over the last decade, according to data from the International Energy Agency (IEA).
| Year | Avg. EV Range | Maximum EV Range |
|---|---|---|
| 2010 | 79 miles (127 km) | N/A |
| 2011 | 86 miles (138 km) | 94 miles (151 km) |
| 2012 | 99 miles (159 km) | 265 miles (426 km) |
| 2013 | 117 miles (188 km) | 265 miles (426 km) |
| 2014 | 130 miles (209 km) | 265 miles (426 km) |
| 2015 | 131 miles (211 km) | 270 miles (435 km) |
| 2016 | 145 miles (233 km) | 315 miles (507 km) |
| 2017 | 151 miles (243 km) | 335 miles (539 km) |
| 2018 | 189 miles (304 km) | 335 miles (539 km) |
| 2019 | 209 miles (336 km) | 370 miles (595 km) |
| 2020 | 210 miles (338 km) | 402 miles (647 km) |
| 2021 | 217 miles (349 km) | 520 miles* (837 km) |
*Max range for EVs offered in the United States.
Source: IEA, U.S. DOE
As of 2021, the average battery-powered EV could travel 217 miles (349 km) on a single charge. It represents a 44% increase from 151 miles (243 km) in 2017 and a 152% increase relative to a decade ago.
Despite the steady growth, EVs still fall short when compared to gas-powered cars. For example, in 2021, the median gas car range (on one full tank) in the U.S. was around 413 miles (664 km)—nearly double what the average EV would cover.
As automakers roll out new models, electric car ranges are likely to continue increasing and could soon match those of their gas-powered counterparts. It’s important to note that EV ranges can change depending on external conditions.
What Affects EV Ranges?
In theory, EV ranges depend on battery capacity and motor efficiency, but real-world results can vary based on several factors:
- Weather: At temperatures below 20℉ (-6.7℃), EVs can lose around 12% of their range, rising to 41% if heating is turned on inside the vehicle.
- Operating Conditions: Thanks to regenerative braking, EVs may extend their maximum range during city driving.
- Speed: When driving at high speeds, EV motors spin faster at a less efficient rate. This may result in range loss.
On the contrary, when driven at optimal temperatures of about 70℉ (21.5℃), EVs can exceed their rated range, according to an analysis by Geotab.
The 10 Longest-Range Electric Cars in America
Here are the 10 longest-range electric cars available in the U.S. as of 2022, based on Environmental Protection Agency (EPA) range estimates:
| Car | Range On One Full Charge | Estimated Base Price |
|---|---|---|
| Lucid Air | 520 miles (837 km) | $170,500 |
| Tesla Model S | 405 miles (652 km) | $106,190 |
| Tesla Model 3 | 358 miles (576 km) | $59,440 |
| Mercedes EQS | 350 miles (563 km) | $103,360 |
| Tesla Model X | 348 miles (560 km) | $122,440 |
| Tesla Model Y | 330 miles (531 km) | $67,440 |
| Hummer EV | 329 miles (529 km) | $110,295 |
| BMW iX | 324 miles (521 km) | $84,195 |
| Ford F-150 Lightning | 320 miles (515 km) | $74,169 |
| Rivian R1S | 316 miles (509 km) | $70,000 |
Source: Car and Driver
The top-spec Lucid Air offers the highest range of any EV with a price tag of $170,500, followed by the Tesla Model S. But the Tesla Model 3 offers the most bang for your buck if range and price are the only two factors in consideration.


Energy
Visualized: A Decade of Clean Energy Investment
In this graphic, Visual Capitalist has partnered with EnergyX to explore the growth of global clean energy investment.
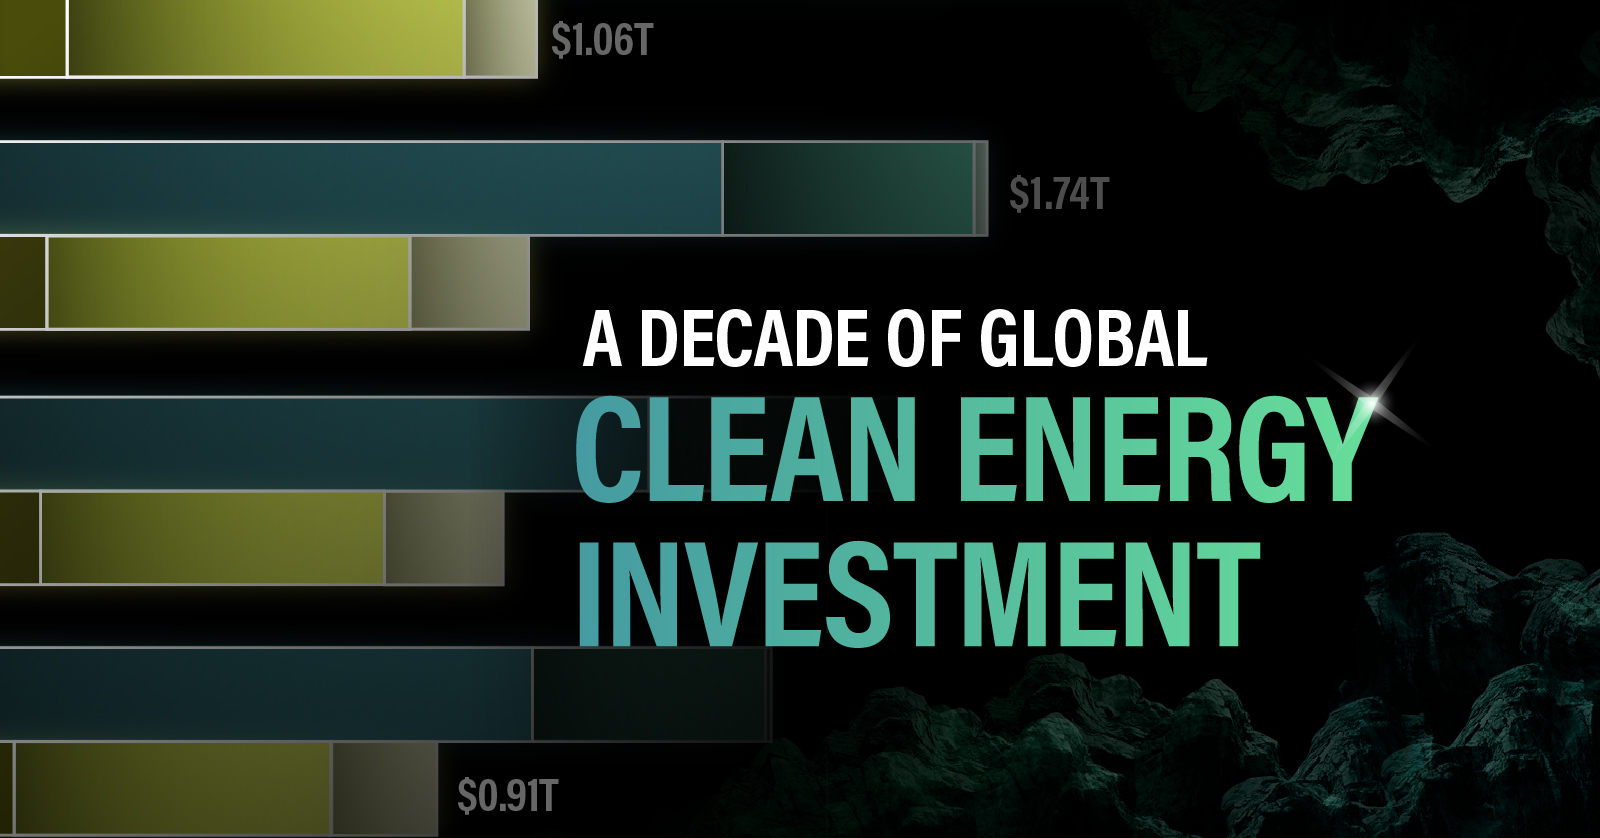
Visualized: A Decade of Clean Energy Investment
Global energy investment is growing every year. But recently, investments in clean energy have been significantly outpacing investments in fossil fuels.
For this graphic, we partnered with EnergyX to explore how global energy investment has changed and learn how investments in clean energy are starting to pay off for their investors.
The Rise of Sustainable Energy Investment
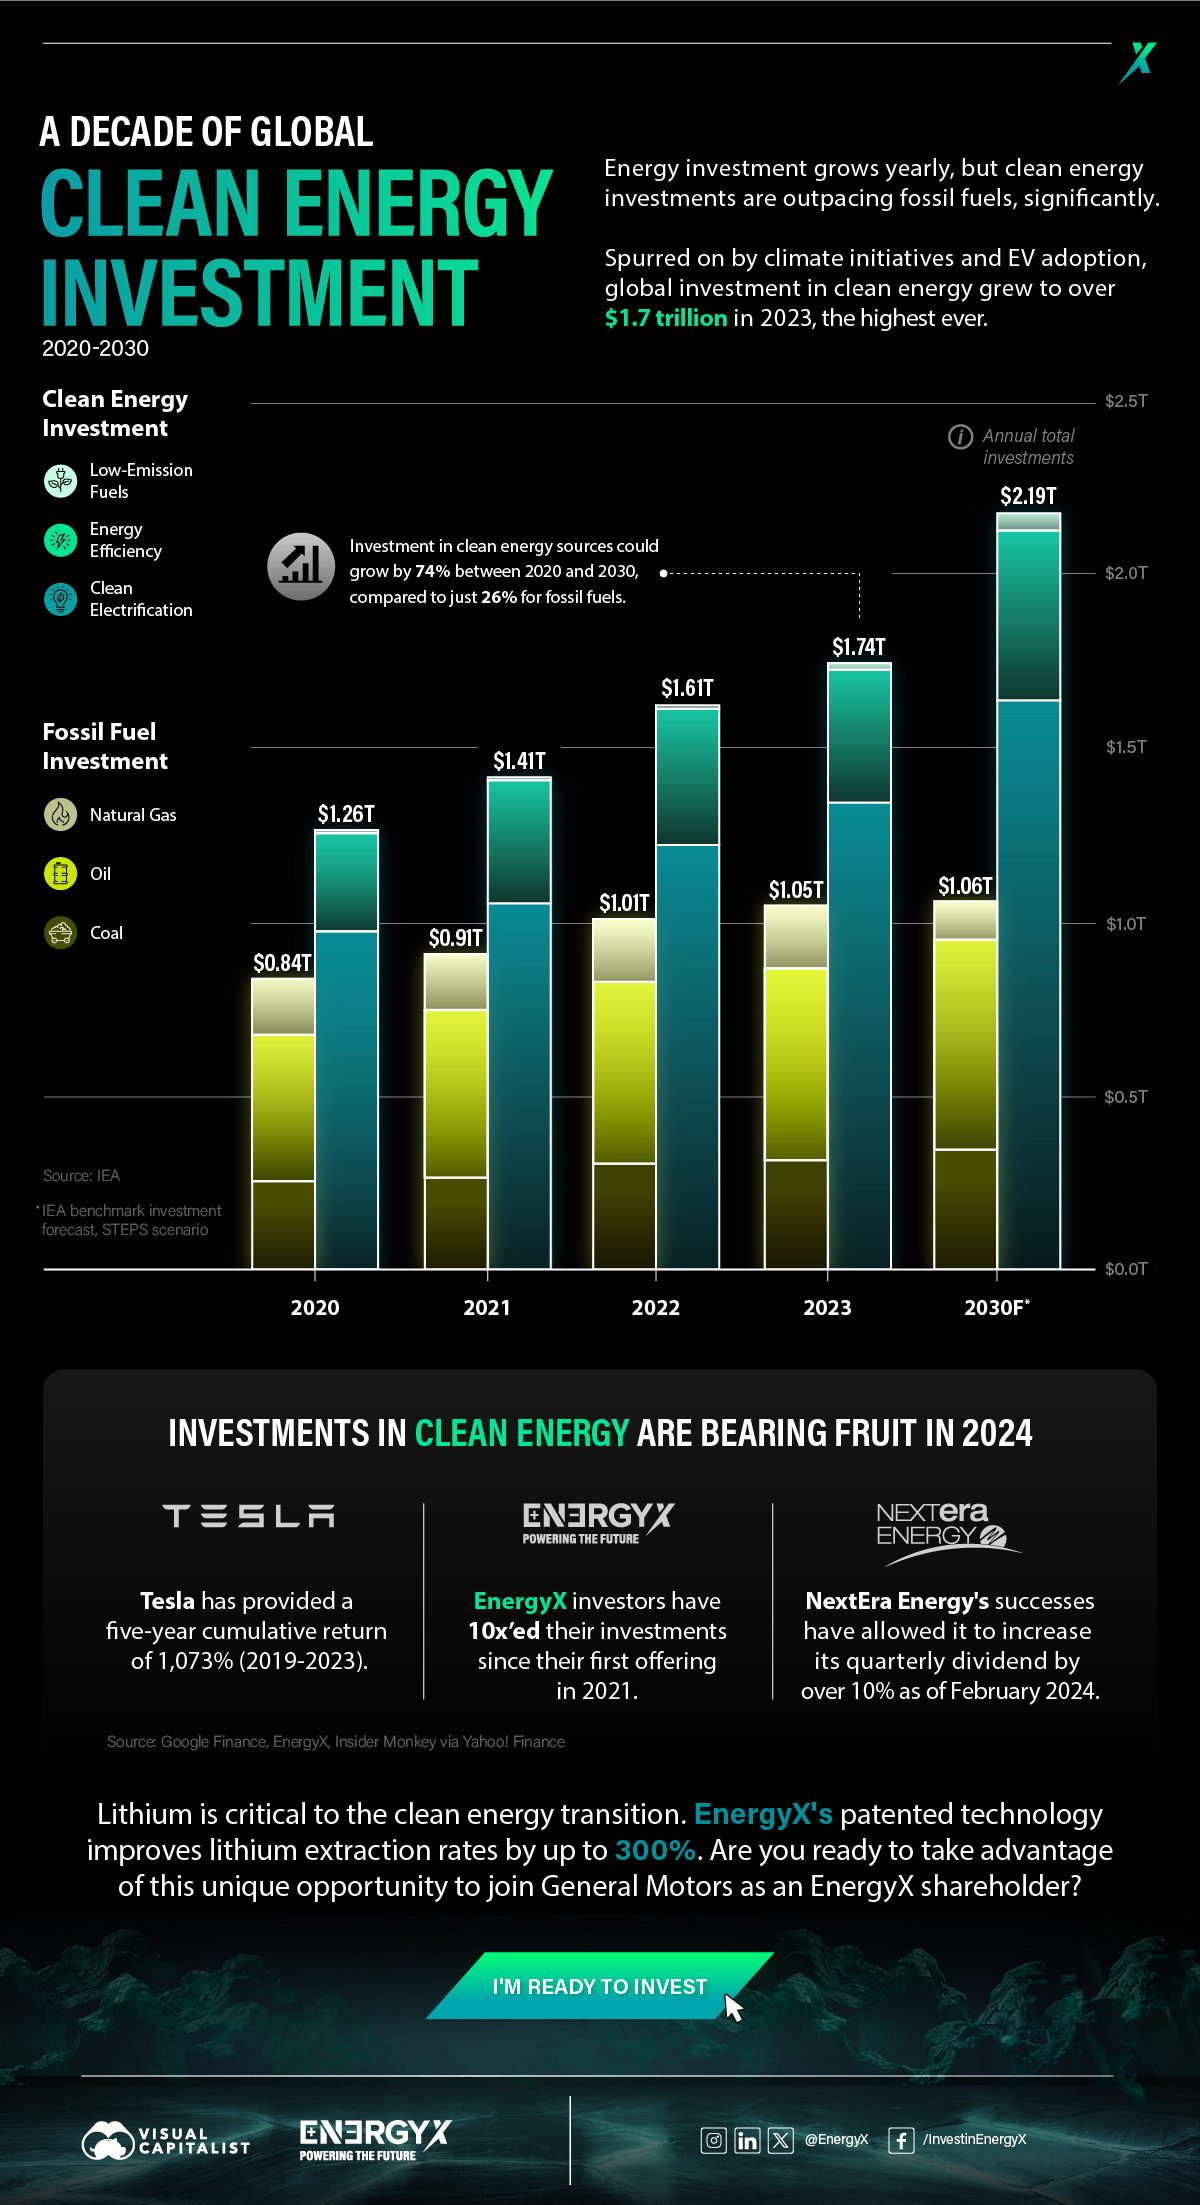
Propelled by various climate initiatives such as the Paris Agreement and the widespread adoption of EVs, global investment in sustainable energy surged to over $1.7 trillion in 2023, the highest ever, and the IEA projects that this growth could continue:
| Energy Product | 2020 | 2021 | 2022 | 2023 | 2030F |
|---|---|---|---|---|---|
| Clean Electrification | $0.97T | $1.05 | $1.21T | $1.34T | $1.65T |
| Low-Emission Fuels | $0.01T | $0.01 | $0.01T | $0.02T | $0.05T |
| Energy Efficiency | $0.28T | $0.35 | $0.39T | $0.38T | $0.49T |
| Clean Energy Total | $1.26T | $1.41T | $1.61T | $1.74T | $2.19T |
| Natural Gas | $0.26T | $0.27T | $0.31T | $0.32T | $0.35T |
| Oil | $0.42T | $0.48T | $0.52T | $0.55T | $0.60T |
| Coal | $0.16T | $0.16T | $0.18T | $0.18T | $0.11T |
| Fossil Fuel Total | $0.84T | $0.91T | $1.01T | $1.05T | $1.06T |
| Total Energy Investment | $2.10T | $2.32T | $2.62T | $2.79T | $3.25T |

Between 2020 and 2030, global investment in sustainable energy could increase by 74% to nearly $2.2 trillion, compared to just 26% additional investment in fossil fuels, with a forecast total of $1.06 trillion. This shows that sustainability is the future of energy investment.
Sustainable Investor Success Stories
While the growing investments in clean energy show that the world embraces sustainability, energy investors will still look for decent returns. Now, in 2024, clean energy investments are beginning to bear fruit. Here are just a few examples:
- Between 2019 and 2023, Tesla had a cumulative return of 1,073%
- NextEra Energy’s quarterly dividend increased by over 10% as of February 2024
- Investors in EnergyX have 10x’ed their investments since the company’s first offering in 2021
Lithium plays a critical role in powering electric vehicles (EVs) and facilitating the transition to sustainable energy. EnergyX has patented technology that enhances lithium extraction rates by up to 300%, contributing to meeting the growing demand for lithium and fueling the EVs of the future.


-

 Energy2 weeks ago
Who’s Building the Most Solar Energy?
China’s solar capacity triples USA, nearly doubles EU.
-

 Energy3 weeks ago
Mapped: The Age of Energy Projects in Interconnection Queues, by State
This map shows how many energy projects are in interconnection queues by state and how long these projects have been queued up, on average.
-

 Energy4 weeks ago
Ranked: The Top 10 EV Battery Manufacturers in 2023
Asia dominates this ranking of the world’s largest EV battery manufacturers in 2023.
-

 Energy1 month ago
The World’s Biggest Nuclear Energy Producers
China has grown its nuclear capacity over the last decade, now ranking second on the list of top nuclear energy producers.
-

 Energy2 months ago
The World’s Biggest Oil Producers in 2023
Just three countries accounted for 40% of global oil production last year.
-

 Energy2 months ago
How Much Does the U.S. Depend on Russian Uranium?
Currently, Russia is the largest foreign supplier of nuclear power fuel to the U.S.


-

 Healthcare2 weeks ago
Which Countries Have the Highest Infant Mortality Rates?
-

 Misc1 week ago
Visualizing Global Losses from Financial Scams
-

 population1 week ago
Mapped: U.S. States By Number of Cities Over 250,000 Residents
-

 Culture1 week ago
Charted: How the Logos of Select Fashion Brands Have Evolved
-

 United States1 week ago
Mapped: Countries Where Recreational Cannabis is Legal
-

 Misc1 week ago
Visualized: Aircraft Carriers by Country
-

 Culture2 weeks ago
How Popular Snack Brand Logos Have Changed
-

 Mining2 weeks ago
Visualizing Copper Production by Country in 2023