Energy
Visualized: EV Market Share in the U.S.
Visualized: EV Market Share in the U.S.
Electric vehicles are a fast growing segment in the U.S., but how much market share have they taken from traditional gasoline cars?
According to recent data from the U.S. Department of Energy, not much.
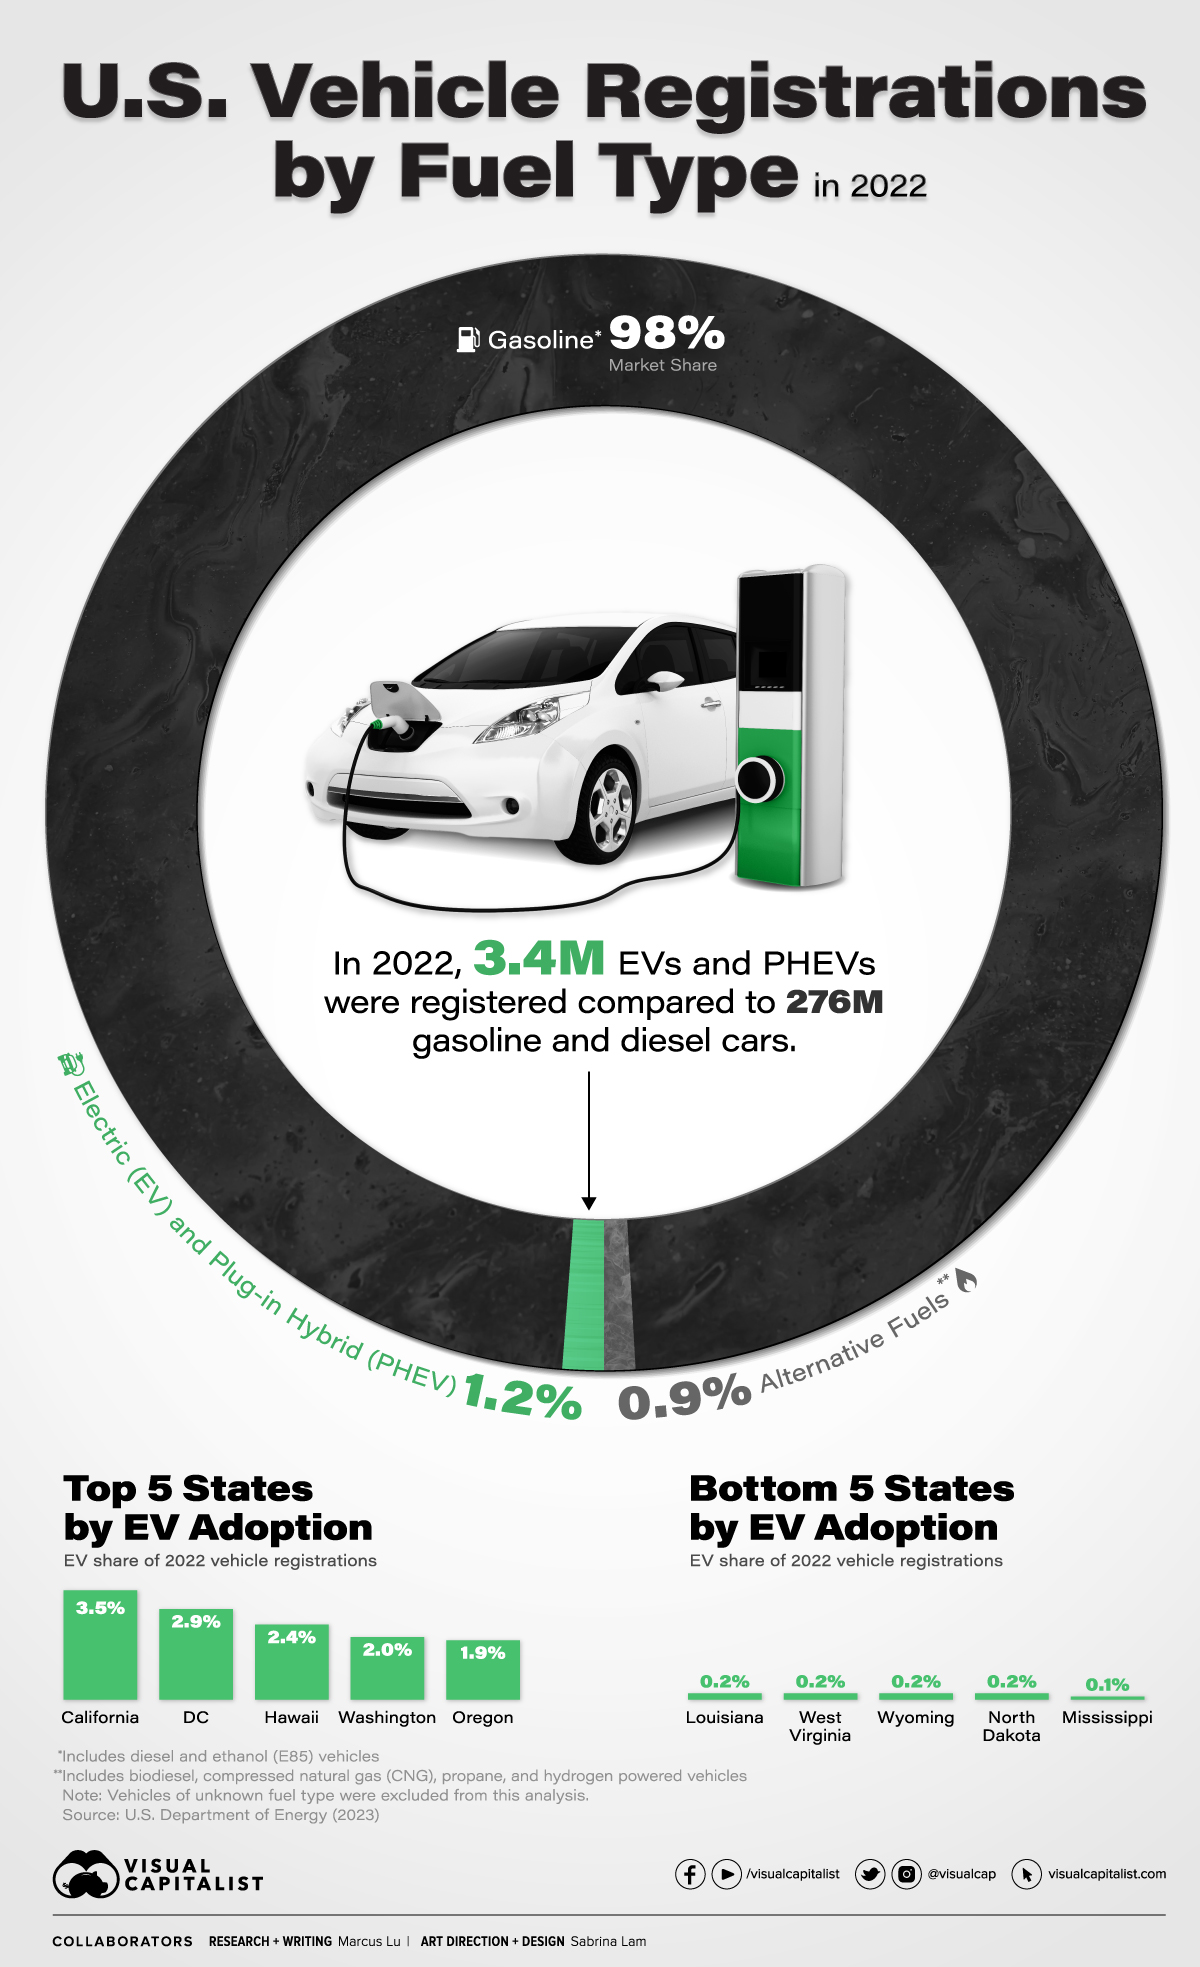
In this graphic, we visualize light-duty vehicle registrations in 2022, broken out by fuel type. It shows that out of the 281 million cars registered nationally, electric (EV) and plug-in hybrid (PHEV) vehicles represented only 1.2%.
Breaking Down the Data
An important distinction to make is that registrations are not the same as sales.
While sales represent the number of new cars sold within a timeframe, registrations reflect the number of cars that are registered with a state’s Department of Motor Vehicles (DMV).
As a result, registrations include both new cars and used cars that have changed ownership. This provides a more comprehensive measure of what cars are on the road.
The following table shows the data we used to create this graphic.
| Fuel Type | Registrations in 2022 | Share of Total |
|---|---|---|
| Gasoline | 275,728,300 | 98.0% |
| EV and PHEV | 3,454,700 | 1.2% |
| Alternative Fuels | 2,573,200 | 0.9% |
It’s worth noting that the gasoline category also includes diesel, E85 flex fuel, and traditional hybrid vehicles, while alternative fuels includes biodiesel, natural gas, propane, and hydrogen.
Vehicles that the Department of Energy categorized as “unknown fuel type” were excluded.
EV Market Share on the Rise
EV adoption in the U.S. has been relatively sluggish compared to the EU and China, though this is beginning to change as automakers roll out more electric SUVs and trucks.
According to Cox Automotive, U.S. EV sales (full battery electric) in Q2 2023 set a new record of 300,000 units, marking a 48% increase from Q2 2022.
For additional context, a total of 800,000 EVs were sold in the U.S. throughout the entire year of 2022, in addition to 190,000 PHEVs.


Who’s Building the Most Solar Energy?
This was originally posted on our Voronoi app. Download the app for free on iOS or Android and discover incredible data-driven charts from a variety of trusted sources.
In 2023, solar energy accounted for three-quarters of renewable capacity additions worldwide. Most of this growth occurred in Asia, the EU, and the U.S., continuing a trend observed over the past decade.
In this graphic, we illustrate the rise in installed solar photovoltaic (PV) capacity in China, the EU, and the U.S. between 2010 and 2022, measured in gigawatts (GW). Bruegel compiled the data..
Chinese Dominance
As of 2022, China’s total installed capacity stands at 393 GW, nearly double that of the EU’s 205 GW and surpassing the USA’s total of 113 GW by more than threefold in absolute terms.
| Installed solar capacity (GW) | China | EU27 | U.S. |
|---|---|---|---|
| 2022 | 393.0 | 205.5 | 113.0 |
| 2021 | 307.0 | 162.7 | 95.4 |
| 2020 | 254.0 | 136.9 | 76.4 |
| 2019 | 205.0 | 120.1 | 61.6 |
| 2018 | 175.3 | 104.0 | 52.0 |
| 2017 | 130.8 | 96.2 | 43.8 |
| 2016 | 77.8 | 91.5 | 35.4 |
| 2015 | 43.6 | 87.7 | 24.2 |
| 2014 | 28.4 | 83.6 | 18.1 |
| 2013 | 17.8 | 79.7 | 13.3 |
| 2012 | 6.7 | 71.1 | 8.6 |
| 2011 | 3.1 | 53.3 | 5.6 |
| 2010 | 1.0 | 30.6 | 3.4 |
Since 2017, China has shown a compound annual growth rate (CAGR) of approximately 25% in installed PV capacity, while the USA has seen a CAGR of 21%, and the EU of 16%.
Additionally, China dominates the production of solar power components, currently controlling around 80% of the world’s solar panel supply chain.
In 2022, China’s solar industry employed 2.76 million individuals, with manufacturing roles representing approximately 1.8 million and the remaining 918,000 jobs in construction, installation, and operations and maintenance.
The EU industry employed 648,000 individuals, while the U.S. reached 264,000 jobs.
According to the IEA, China accounts for almost 60% of new renewable capacity expected to become operational globally by 2028.
Despite the phasing out of national subsidies in 2020 and 2021, deployment of solar PV in China is accelerating. The country is expected to reach its national 2030 target for wind and solar PV installations in 2024, six years ahead of schedule.

-

 Markets5 days ago
Visualizing Global Inflation Forecasts (2024-2026)
-

 Green2 weeks ago
The Carbon Footprint of Major Travel Methods
-

 United States2 weeks ago
Visualizing the Most Common Pets in the U.S.
-

 Culture2 weeks ago
The World’s Top Media Franchises by All-Time Revenue
-

 voronoi1 week ago
Best Visualizations of April on the Voronoi App
-

 Wealth1 week ago
Charted: Which Country Has the Most Billionaires in 2024?
-

 Business1 week ago
The Top Private Equity Firms by Country
-

 Markets1 week ago
The Best U.S. Companies to Work for According to LinkedIn