

Which countries rank the highest in per capita carbon emissions, and how do they impact the world's total carbon emissions?
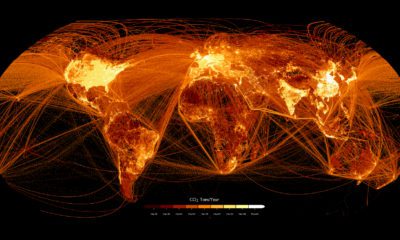

This graphic maps out carbon emissions around the world and where they come from, using data from the European Commission.
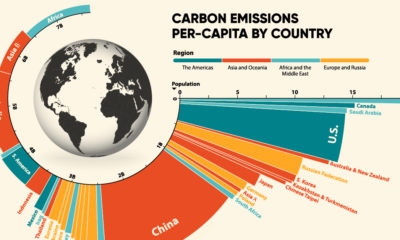

33.6 Gt of CO2 was emitted across the world in 2019. Here we visualize the global per capita CO2 emissions by country and region.


 Creator Program