

Tesla and BYD have once again swapped places as the global leader in BEV sales.


This graphic breaks down America's most preferred smartphone brands, according to a December 2023 consumer survey.

In this graphic, we show asset class returns across U.S. equities, bonds, real estate, gold and cash since 1970.


Here's how GPUs differ from traditional CPUs and what gives them an edge in many high-performance computing applications.


We compare America's top 10 companies by revenue in 1994 and 2023 to see how the business landscape has changed.


In this graphic, we illustrate the top ten emerging markets according to their foreign direct investment (FDI) momentum in 2024.


Which OECD countries have the largest gender pay gaps? We look at the 10 countries with gaps higher than the average.


See how the Nasdaq debut of Trump Media & Technology Group has influenced Trump's net worth, according to Forbes estimates.
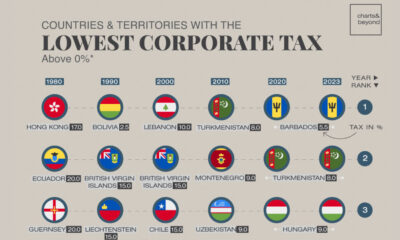

Many countries with the lowest corporate tax rates are clustered in Europe and Asia, with tax rates far below the global average.
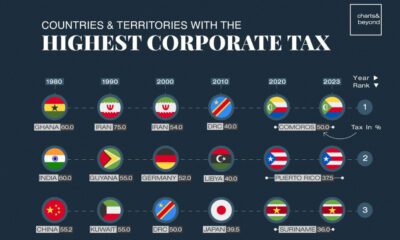

The world's top corporate tax rate stands at 50%, far higher than the global average. Here are the top 10 countries with the highest rates.


 Creator Program