

What were the top data visualizations on Visual Capitalist in 2023? We highlight the best charts, maps, and infographics from the year.


In this ninth edition of our yearly round-up, we highlight visualizations that broke new ground in design and data-driven reporting.
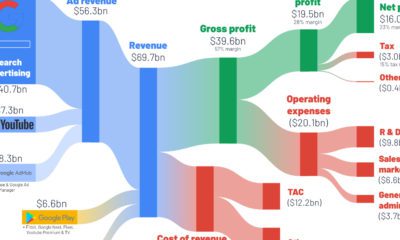

How do the big tech giants make their money? This series of graphics shows a breakdown of big tech revenue, using Q2 2022 income statements.
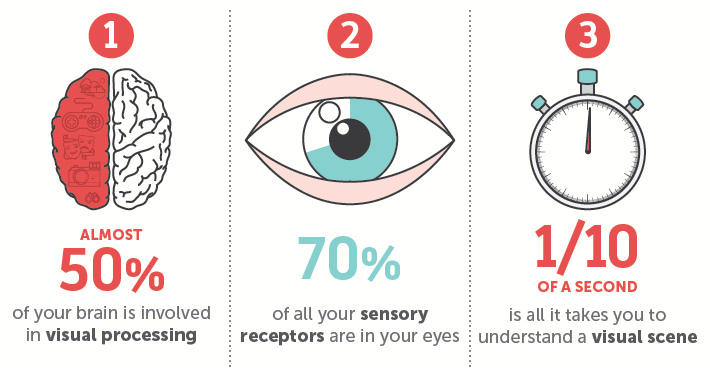
Why are our brains addicted to visually stimulating content such as infographics or charts? Here's the scientific evidence behind why we crave visuals.


 Creator Program