Misc
The Roman Empire’s Roads In Transit Map Form
View the full version of this graphic.

The Roman Empire’s Roads In Transit Map Form
View the high resolution version of the map by clicking here.
Unless you’re a historian or map buff, interpreting a map of the Roman Empire can be a daunting exercise. Place names are unfamiliar and roads meander across the landscape making it difficult to see the connections between specific cities and towns.
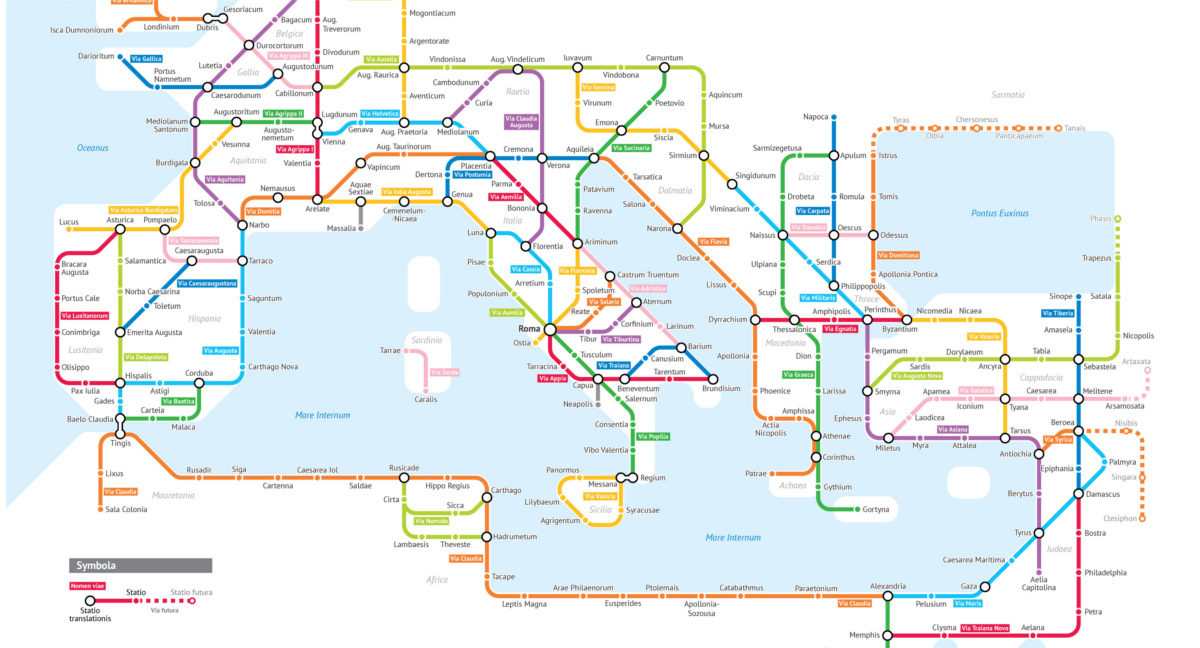
Today’s visualization, by Sasha Trubetskoy, has mashed-up two enduring obsessions – transit maps and Ancient Rome – to help us understand the connection between Rome and its sprawling empire.
At the height of the Roman Empire, there were approximately 250,000 miles (400,000 km) of roads, stretching from Northern England to Egypt and beyond. This impressive network is what allowed Rome to exercise control and communicate effectively over such a large territory.
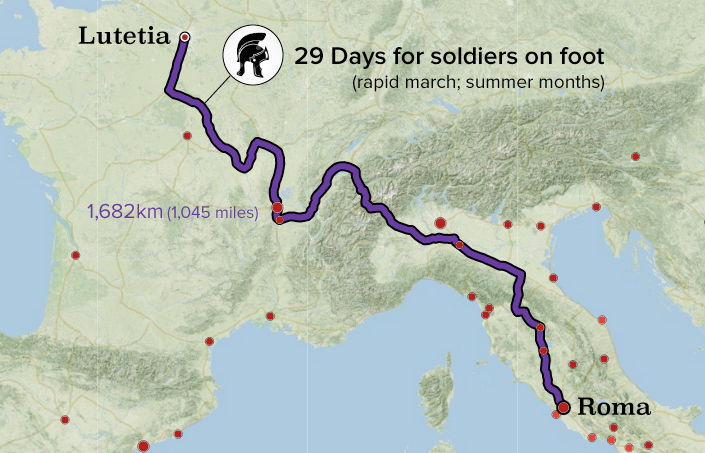
For a detailed look at travel times and costs, check out Stanford’s amazing ORBIS platform. The screenshot below shows the fastest, cheapest, and shortest routes between the settlement of Lutetia (the predecessor of present-day Paris) and Roma.
There were three main types of roads in Ancient Rome:
Viae publicae: Public highways or main roads, typically maintained by the military. These were the main, paved arteries of the empire and often included infrastructure such as drainage, milestones, and way stations.
Viae privatae: Private or country roads were financed by wealthy individuals to connect towns and other noteworthy points to the viae publicae.
Viae vicinales: These tertiary (often dirt) roads connected villages and areas within districts, eventually linking to the larger network.
This network of roads was vital as it allowed for quick troop movement as well as the development of a mail system. As the first major road network in Europe, the Romans quite literally laid the foundation for development across the continent.
There’s something alluring about Rome’s ability to carve out such a huge and advanced empire, with a legacy that lasts today.
– Sasha Trubetskoy
The Enduring Influence of Roman Roads
London, Paris, Barcelona, and countless other major cities sprang from Roman settlements along the road network, and even as Europe descended into the Dark Ages (476-800 CE), Roman roads remained as one of few functioning modes of movement and communication. A recent study even points out that proximity to that foundational network of roads even has a strong correlation with economic activity today.
Beyond mere curiosity or entertainment, looking back at Roman ingenuity allows us to see the impact their road network had on today’s world. That enduring influence is one of the reasons ancient Rome still fascinates us to this day.
For more reading, check out Trubetskoy’s followup, Roman Roads of Britain.


Misc
The Top 25 Nationalities of U.S. Immigrants
Mexico is the largest source of immigrants to the U.S., with almost 11 million immigrants.


The Top 25 Nationalities of U.S. Immigrants
This was originally posted on our Voronoi app. Download the app for free on iOS or Android and discover incredible data-driven charts from a variety of trusted sources.
The United States is home to more than 46 million immigrants, constituting approximately 14% of its total population.
This graphic displays the top 25 countries of origin for U.S. immigrants, based on 2022 estimates. The data is sourced from the Migration Policy Institute (MPI), which analyzed information from the U.S. Census Bureau’s 2022 American Community Survey.
In this context, “immigrants” refer to individuals residing in the United States who were not U.S. citizens at birth.
Mexico Emerges as a Leading Source of Immigration
Mexico stands out as the largest contributor to U.S. immigration due to its geographical proximity and historical ties.
Various economic factors, including wage disparities and employment opportunities, motivate many Mexicans to seek better prospects north of the border.
| Country | Region | # of Immigrants |
|---|---|---|
| 🇲🇽 Mexico | Latin America & Caribbean | 10,678,502 |
| 🇮🇳 India | Asia | 2,839,618 |
| 🇨🇳 China | Asia | 2,217,894 |
| 🇵🇭 Philippines | Asia | 1,982,333 |
| 🇸🇻 El Salvador | Latin America & Caribbean | 1,407,622 |
| 🇻🇳 Vietnam | Asia | 1,331,192 |
| 🇨🇺 Cuba | Latin America & Caribbean | 1,312,510 |
| 🇩🇴 Dominican Republic | Latin America & Caribbean | 1,279,900 |
| 🇬🇹 Guatemala | Latin America & Caribbean | 1,148,543 |
| 🇰🇷 Korea | Asia | 1,045,100 |
| 🇨🇴 Colombia | Latin America & Caribbean | 928,053 |
| 🇭🇳 Honduras | Latin America & Caribbean | 843,774 |
| 🇨🇦 Canada | Northern America | 821,322 |
| 🇯🇲 Jamaica | Latin America & Caribbean | 804,775 |
| 🇭🇹 Haiti | Latin America & Caribbean | 730,780 |
| 🇬🇧 United Kingdom | Europe | 676,652 |
| 🇻🇪 Venezuela | Latin America & Caribbean | 667,664 |
| 🇧🇷 Brazil | Latin America & Caribbean | 618,525 |
| 🇩🇪 Germany | Europe | 537,484 |
| 🇪🇨 Ecuador | Latin America & Caribbean | 518,287 |
| 🇵🇪 Peru | Latin America & Caribbean | 471,988 |
| 🇳🇬 Nigeria | Africa | 448,405 |
| 🇺🇦 Ukraine | Europe | 427,163 |
| 🇮🇷 Iran | Middle East | 407,283 |
| 🇵🇰 Pakistan | Asia | 399,086 |
| Rest of World | 11,637,634 | |
| Total | 46,182,089 |
Mexicans are followed in this ranking by Indians, Chinese, and Filipinos, though most immigrants on this list come from countries in the Latin American and Caribbean region.
On the other hand, only three European countries are among the top sources of U.S. immigrants: the UK, Germany, and Ukraine.
Immigration continues to be a significant factor contributing to the overall growth of the U.S. population. Overall population growth has decelerated over the past decade primarily due to declining birth rates.
Between 2021 and 2022, the increase in the immigrant population accounted for 65% of the total population growth in the U.S., representing 912,000 individuals out of nearly 1.4 million.
If you enjoyed this post, be sure to check out Visualized: Why Do People Immigrate to the U.S.? This visualization shows the different reasons cited by new arrivals to America in 2021.

-

 Mining1 week ago
Where the World’s Aluminum is Smelted, by Country
-

 Culture6 days ago
How Popular Snack Brand Logos Have Changed
-

 Mining7 days ago
Visualizing Copper Production by Country in 2023
-

 Politics1 week ago
Charted: How Americans Feel About Federal Government Agencies
-

 Healthcare1 week ago
Which Countries Have the Highest Infant Mortality Rates?
-

 Demographics1 week ago
Mapped: U.S. Immigrants by Region
-

 Economy1 week ago
Mapped: Southeast Asia’s GDP Per Capita, by Country
-

 Automotive1 week ago
How People Get Around in America, Europe, and Asia