Markets
Ranked: The Largest Bond Markets in the World
Subscribe to the Advisor Channel free mailing list for more like this
The Largest Bond Markets in the World
This was originally posted on Advisor Channel. Sign up to the free mailing list to get beautiful visualizations on financial markets that help advisors and their clients.
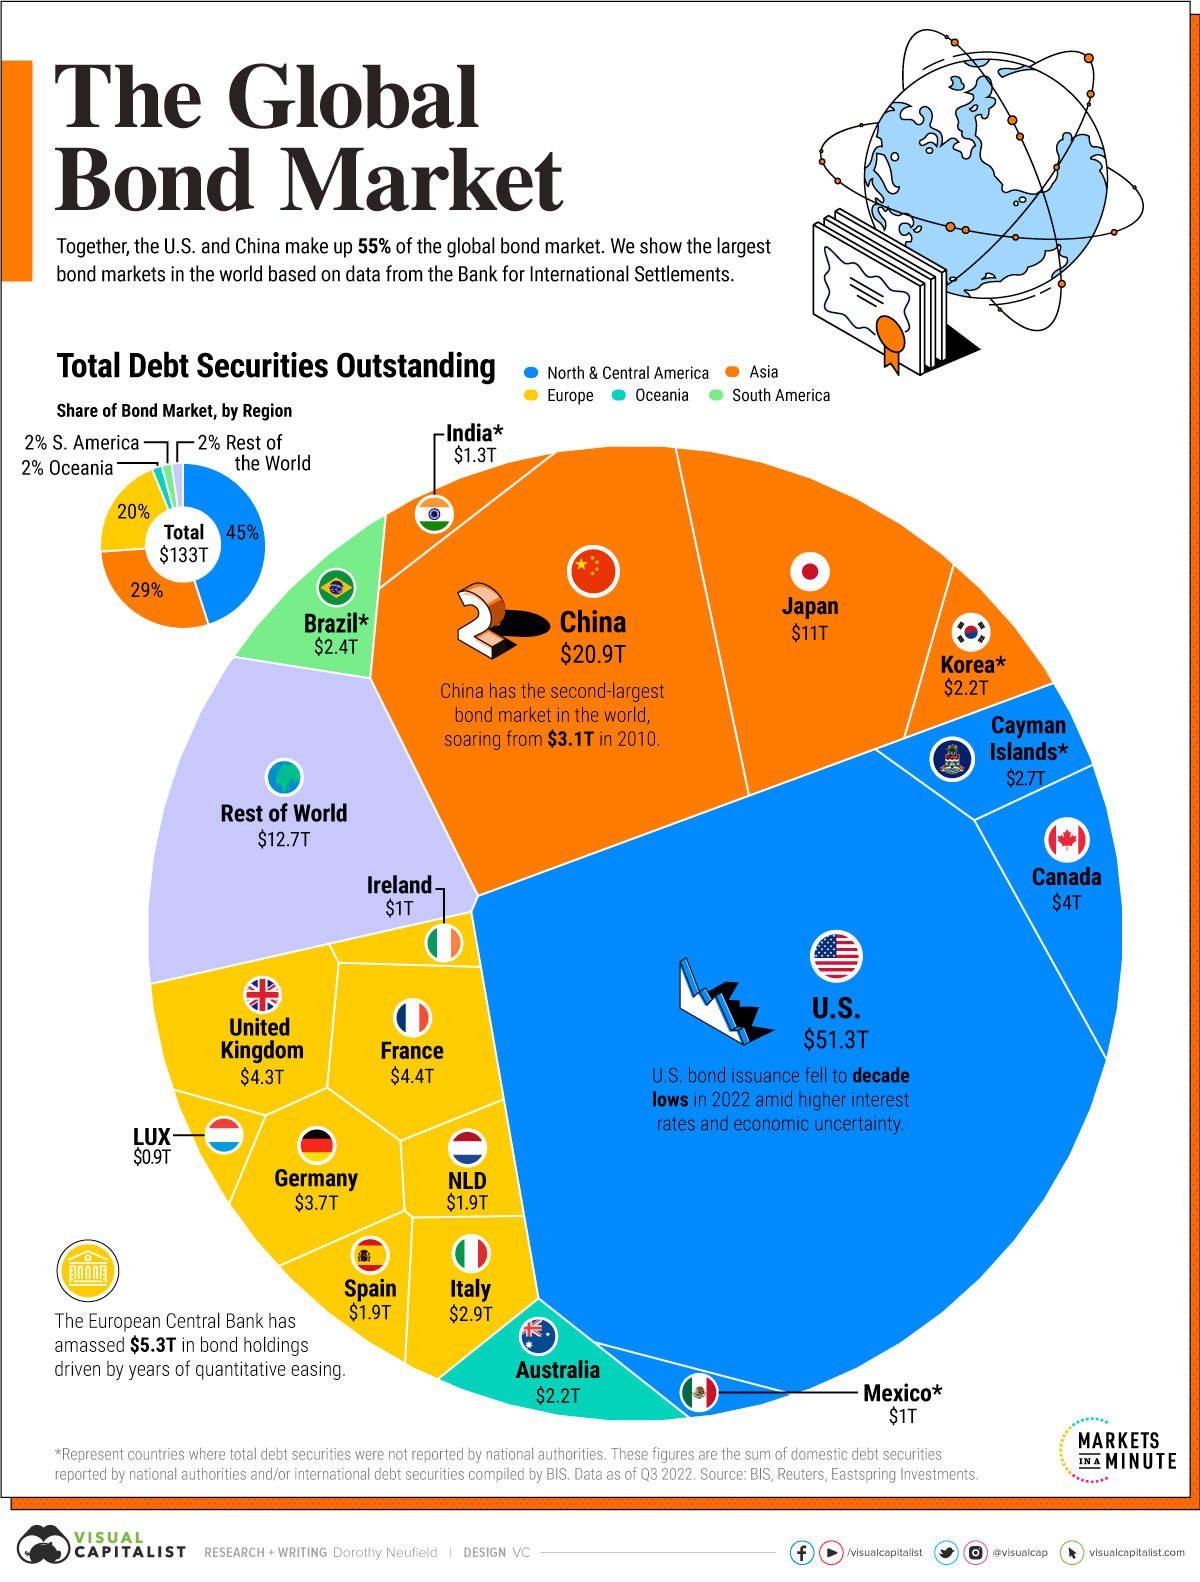
In 2022, the global bond market totaled $133 trillion.
As one of the world’s largest capital markets, debt securities have grown sevenfold over the last 40 years. Fueling this growth are government and corporate debt sales across major economies and emerging markets. Over the last three years, China’s bond market has grown 13% annually.
Based on estimates from the Bank for International Statements, this graphic shows the largest bond markets in the world.
Ranked: The World’s Top Bond Markets
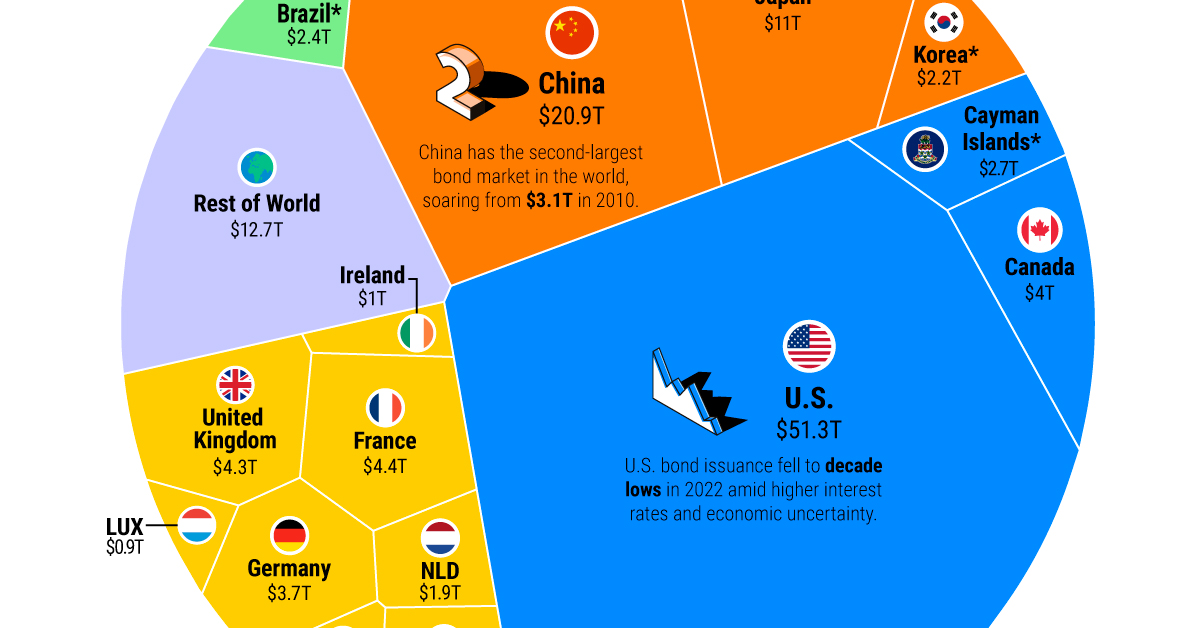
Valued at over $51 trillion, the U.S. has the largest bond market globally.
Government bonds made up the majority of its debt market, with over $26 trillion in securities outstanding. In 2022, the Federal government paid $534 billion in interest on this debt.
China is second, at 16% of the global total. Local commercial banks hold the greatest share of its outstanding bonds, while foreign ownership remains fairly low. Foreign interest in China’s bonds slowed in 2022 amid geopolitical tensions in Ukraine and lower yields.
| Bond Market Rank | Country / Region | Total Debt Outstanding | Share of Total Bond Market |
|---|---|---|---|
| 1 | 🇺🇸 U.S. | $51.3T | 39% |
| 2 | 🇨🇳 China | $20.9T | 16% |
| 3 | 🇯🇵 Japan | $11.0T | 8% |
| 4 | 🇫🇷 France | $4.4T | 3% |
| 5 | 🇬🇧 United Kingdom | $4.3T | 3% |
| 6 | 🇨🇦 Canada | $4.0T | 3% |
| 7 | 🇩🇪 Germany | $3.7T | 3% |
| 8 | 🇮🇹 Italy | $2.9T | 2% |
| 9 | 🇰🇾 Cayman Islands* | $2.7T | 2% |
| 10 | 🇧🇷 Brazil* | $2.4T | 2% |
| 11 | 🇰🇷 South Korea* | $2.2T | 2% |
| 12 | 🇦🇺 Australia | $2.2T | 2% |
| 13 | 🇳🇱 Netherlands | $1.9T | 1% |
| 14 | 🇪🇸 Spain | $1.9T | 1% |
| 15 | 🇮🇳 India* | $1.3T | 1% |
| 16 | 🇮🇪 Ireland | $1.0T | 1% |
| 17 | 🇲🇽 Mexico* | $1.0T | 1% |
| 18 | 🇱🇺 Luxembourg | $0.9T | 1% |
| 19 | 🇧🇪 Belgium | $0.7T | >1% |
| 20 | 🇷🇺 Russia* | $0.7T | >1% |
*Represent countries where total debt securities were not reported by national authorities. These figures are the sum of domestic debt securities reported by national authorities and/or international debt securities compiled by BIS.
Data as of Q3 2022.
As the above table shows, Japan has the third biggest debt market. Japan’s central bank owns a massive share of its government bonds. Central bank ownership hit a record 50% as it tweaked its yield curve control policy that was introduced in 2016. The policy was designed to help boost inflation and prevent interest rates from falling. As inflation began to rise in 2022 and bond investors began selling, it had to increase its yield to spur demand and liquidity. The adjustment sent shockwaves through financial markets.
In Europe, France is home to the largest bond market at $4.4 trillion in total debt, surpassing the United Kingdom by roughly $150 billion.
Banks: A Major Buyer in Bond Markets
Like central banks around the world, commercial banks are key players in bond markets.
In fact, commercial banks are among the top three buyers of U.S. government debt. This is because commercial banks will reinvest client deposits into interest-bearing securities. These often include U.S. Treasuries, which are highly liquid and one of the safest assets globally.
As we can see in the chart below, the banking sector often surpasses an economy’s total GDP.
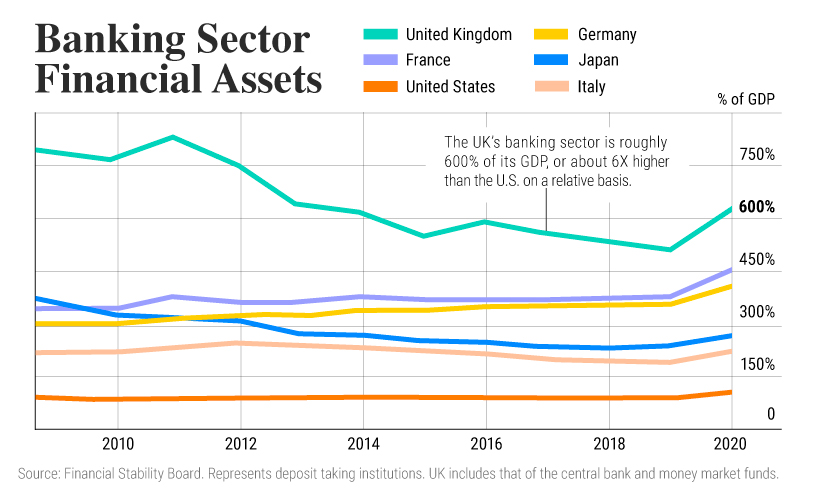
As interest rates have risen sharply since 2022, the price of bonds has been pushed down, given their inverse relationship. This has raised questions about what type of bonds banks hold.
In the U.S., commercial banks hold $4.2 trillion in Treasury bonds and other government securities. For large U.S. banks, these holdings account for almost 24% of assets on average. They make up an average 15% of assets for small banks in 2023. Since mid-2022, small banks have reduced their bond holdings due to interest rate increases.
As higher rates reverberate across the banking system and wider economy, it may expose further strains on global bond markets which have expanded rapidly in an era of dovish monetary policy and ultra-low interest rates.


Markets
Mapped: Europe’s GDP Per Capita, by Country
Which European economies are richest on a GDP per capita basis? This map shows the results for 44 countries across the continent.


Mapped: Europe’s GDP Per Capita, by Country (2024)
This was originally posted on our Voronoi app. Download the app for free on iOS or Android and discover incredible data-driven charts from a variety of trusted sources.
Europe is home to some of the largest and most sophisticated economies in the world. But how do countries in the region compare with each other on a per capita productivity basis?
In this map, we show Europe’s GDP per capita levels across 44 nations in current U.S. dollars. Data for this visualization and article is sourced from the International Monetary Fund (IMF) via their DataMapper tool, updated April 2024.
Europe’s Richest and Poorest Nations, By GDP Per Capita
Luxembourg, Ireland, and Switzerland, lead the list of Europe’s richest nations by GDP per capita, all above $100,000.
| Rank | Country | GDP Per Capita (2024) |
|---|---|---|
| 1 | 🇱🇺 Luxembourg | $131,380 |
| 2 | 🇮🇪 Ireland | $106,060 |
| 3 | 🇨🇭 Switzerland | $105,670 |
| 4 | 🇳🇴 Norway | $94,660 |
| 5 | 🇮🇸 Iceland | $84,590 |
| 6 | 🇩🇰 Denmark | $68,900 |
| 7 | 🇳🇱 Netherlands | $63,750 |
| 8 | 🇸🇲 San Marino | $59,410 |
| 9 | 🇦🇹 Austria | $59,230 |
| 10 | 🇸🇪 Sweden | $58,530 |
| 11 | 🇧🇪 Belgium | $55,540 |
| 12 | 🇫🇮 Finland | $55,130 |
| 13 | 🇩🇪 Germany | $54,290 |
| 14 | 🇬🇧 UK | $51,070 |
| 15 | 🇫🇷 France | $47,360 |
| 16 | 🇦🇩 Andorra | $44,900 |
| 17 | 🇲🇹 Malta | $41,740 |
| 18 | 🇮🇹 Italy | $39,580 |
| 19 | 🇨🇾 Cyprus | $37,150 |
| 20 | 🇪🇸 Spain | $34,050 |
| 21 | 🇸🇮 Slovenia | $34,030 |
| 22 | 🇪🇪 Estonia | $31,850 |
| 23 | 🇨🇿 Czech Republic | $29,800 |
| 24 | 🇵🇹 Portugal | $28,970 |
| 25 | 🇱🇹 Lithuania | $28,410 |
| 26 | 🇸🇰 Slovakia | $25,930 |
| 27 | 🇱🇻 Latvia | $24,190 |
| 28 | 🇬🇷 Greece | $23,970 |
| 29 | 🇭🇺 Hungary | $23,320 |
| 30 | 🇵🇱 Poland | $23,010 |
| 31 | 🇭🇷 Croatia | $22,970 |
| 32 | 🇷🇴 Romania | $19,530 |
| 33 | 🇧🇬 Bulgaria | $16,940 |
| 34 | 🇷🇺 Russia | $14,390 |
| 35 | 🇹🇷 Türkiye | $12,760 |
| 36 | 🇲🇪 Montenegro | $12,650 |
| 37 | 🇷🇸 Serbia | $12,380 |
| 38 | 🇦🇱 Albania | $8,920 |
| 39 | 🇧🇦 Bosnia & Herzegovina | $8,420 |
| 40 | 🇲🇰 North Macedonia | $7,690 |
| 41 | 🇧🇾 Belarus | $7,560 |
| 42 | 🇲🇩 Moldova | $7,490 |
| 43 | 🇽🇰 Kosovo | $6,390 |
| 44 | 🇺🇦 Ukraine | $5,660 |
| N/A | 🇪🇺 EU Average | $44,200 |
Note: Figures are rounded.
Three Nordic countries (Norway, Iceland, Denmark) also place highly, between $70,000-90,000. Other Nordic peers, Sweden and Finland rank just outside the top 10, between $55,000-60,000.
Meanwhile, Europe’s biggest economies in absolute terms, Germany, UK, and France, rank closer to the middle of the top 20, with GDP per capitas around $50,000.
Finally, at the end of the scale, Eastern Europe as a whole tends to have much lower per capita GDPs. In that group, Ukraine ranks last, at $5,660.
A Closer Look at Ukraine
For a broader comparison, Ukraine’s per capita GDP is similar to Iran ($5,310), El Salvador ($5,540), and Guatemala ($5,680).
According to experts, Ukraine’s economy has historically underperformed to expectations. After the fall of the Berlin Wall, the economy contracted for five straight years. Its transition to a Western, liberalized economic structure was overshadowed by widespread corruption, a limited taxpool, and few revenue sources.
Politically, its transformation from authoritarian regime to civil democracy has proved difficult, especially when it comes to institution building.
Finally, after the 2022 invasion of the country, Ukraine’s GDP contracted by 30% in a single year—the largest loss since independence. Large scale emigration—to the tune of six million refugees—is also playing a role.
Despite these challenges, the country’s economic growth has somewhat stabilized while fighting continues.

-

 United States5 days ago
Charted: What Southeast Asia Thinks About China & the U.S.
-

 United States2 weeks ago
Visualizing the Most Common Pets in the U.S.
-

 Culture2 weeks ago
The World’s Top Media Franchises by All-Time Revenue
-

 voronoi2 weeks ago
Best Visualizations of April on the Voronoi App
-

 Wealth1 week ago
Charted: Which Country Has the Most Billionaires in 2024?
-

 Business1 week ago
The Top Private Equity Firms by Country
-

 Markets1 week ago
The Best U.S. Companies to Work for According to LinkedIn
-

 Economy1 week ago
Ranked: The Top 20 Countries in Debt to China