Mining
Prove Your Metal: Top 10 Strongest Metals on Earth
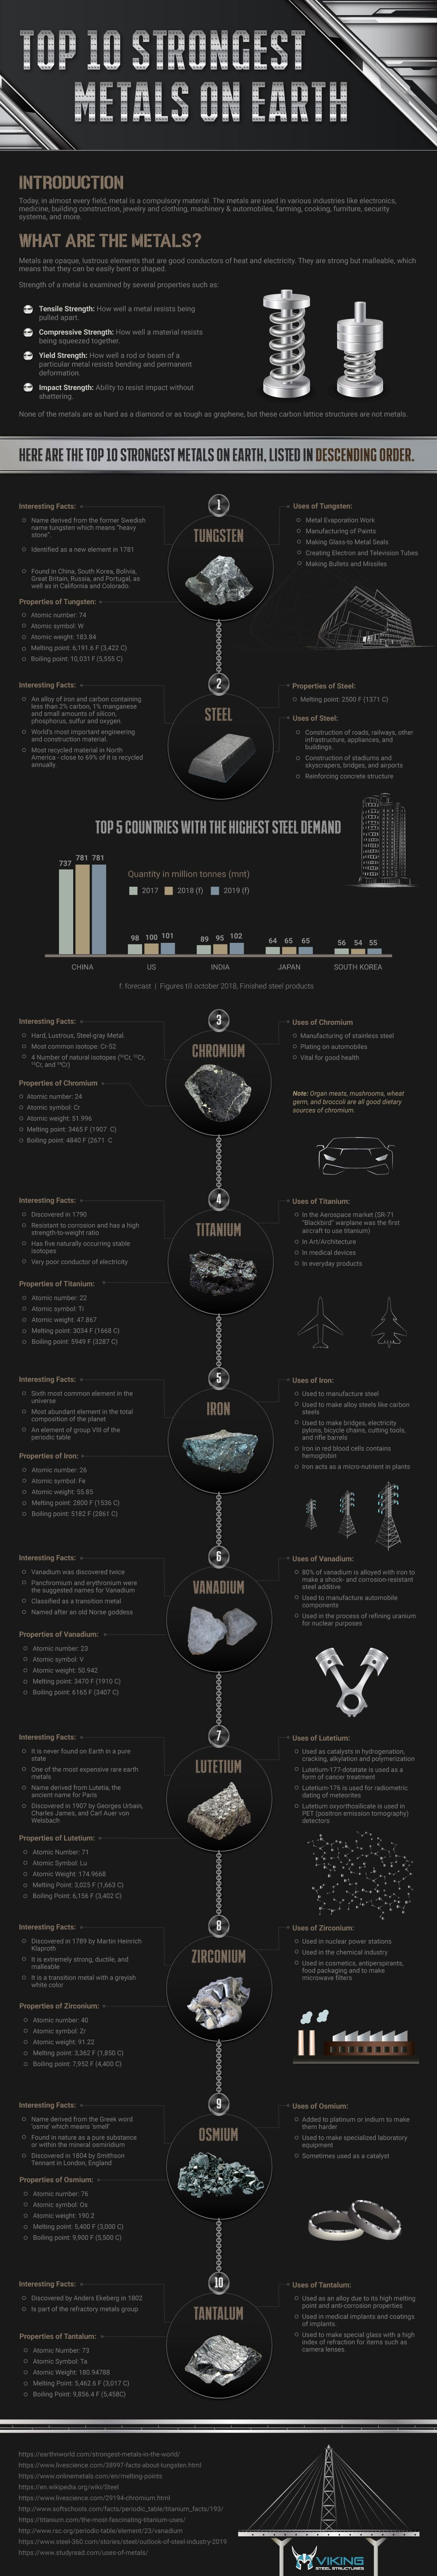
Prove Your Metal: Top 10 Strongest Metals on Earth
The use of metals and the advancement of human civilization have gone hand in hand — and throughout the ages, each metal has proved its worth based on its properties and applications.
Today’s visualization from Viking Steel Structures outlines the 10 strongest metals on Earth and their applications.
What are Metals?
Metals are solid materials that are typically hard, shiny, malleable, and ductile, with good electrical and thermal conductivity. But not all metal is equal, which makes their uses as varied as their individual properties and benefits.
The periodic table below presents a simple view of the relationship between metals, nonmetals, and metalloids, which you can easily identify by color.
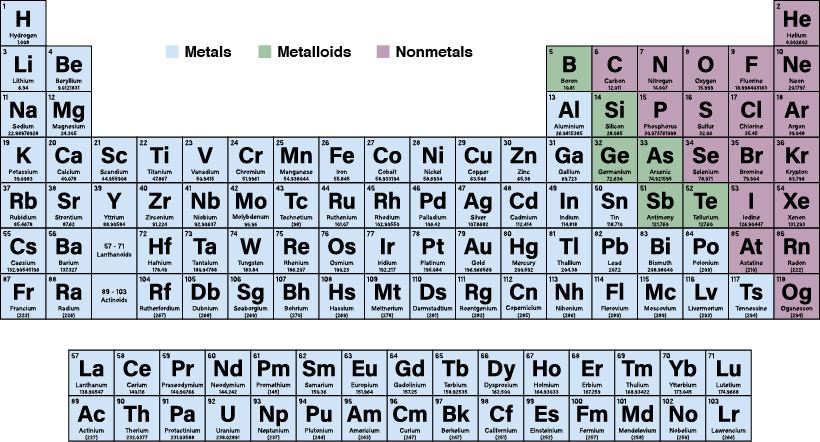
While 91 of the 118 elements of the periodic table are considered to be metals, only a few of them stand out as the strongest.
What Makes a Metal Strong?
The strength of a metal depends on four properties:
- Tensile Strength: How well a metal resists being pulled apart
- Compressive Strength: How well a material resists being squashed together
- Yield Strength: How well a rod or beam of a particular metal resists bending and permanent damage
- Impact Strength: The ability to resist shattering upon impact with another object or surface
Here are the top 10 metals based on these properties.
The Top 10 Strongest Metals
| Rank | Type of Metal | Example Use | Atomic Weight | Melting Point |
|---|---|---|---|---|
| #1 | Tungsten | Making bullets and missiles | 183.84 u | 3422°C / 6192 °F |
| #2 | Steel | Construction of railroads, roads, other infrastructure and appliances | n/a | 1371°C / 2500°F |
| #3 | Chromium | Manufacturing stainless steel | 51.96 u | 1907°C / 3465°F, |
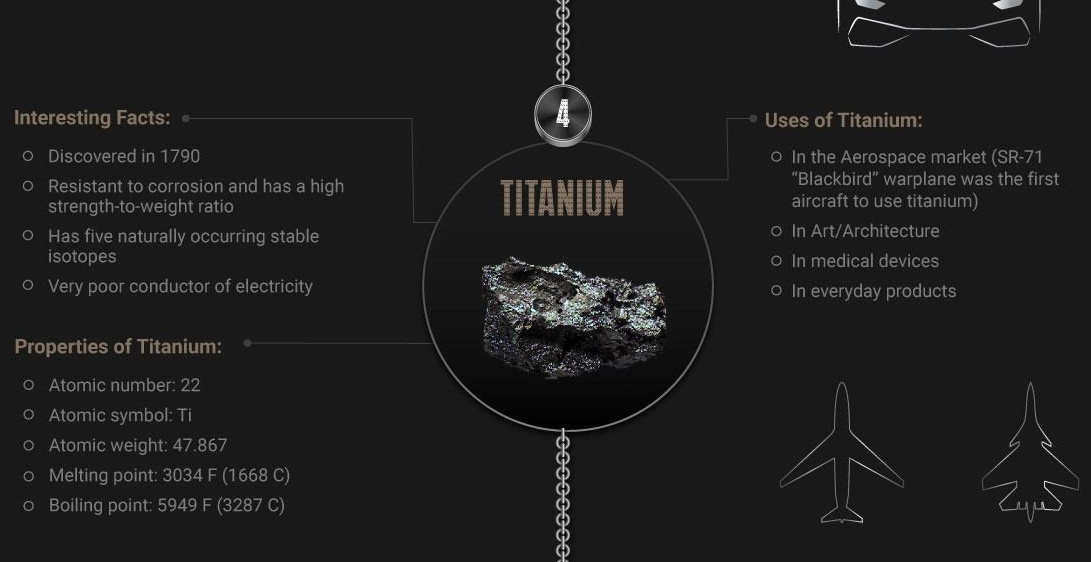
| #4 | Titanium | In the aerospace Industry, as a lightweight material with strength | 47.87 u | 1668°C / 3032°F |
| #5 | Iron | Used to make bridges, electricity, pylons, bicycle chains, cutting tools and rifle barrels | 55.85 u | 1536°C / 2800°F |
| #6 | Vanadium | 80% of vanadium is alloyed with iron to make steel shock and corrosion resistance | 50.942 u | 1910°C / 3470°F |
| #7 | Lutetium | Used as catalysts in petroleum production. | 174.96 u | 1663 °C / 3025°F |
| #8 | Zirconium | Used in nuclear power stations. | 91.22 u | 1850°C / 3.362°F |
| #9 | Osmium | Added to platinum or indium to make them harder. | 190.2 u | 3000°C / 5,400°F |
| #10 | Tantalum | Used as an alloy due to its high melting point and anti-corrosion. | 180.94 u | 3,017°C / 5462°F |
Out of the Forge and into Tech: Metals for the Future
While these metals help to forge the modern world, there is a new class of metals that are set to create a new future.
Rare Earth elements (REEs) are a group of metals do not rely on their strength, but instead their importance in applications in new technologies, including those used for green energy.
| Metal | Uses |
|---|---|
| Neodymium | Magnets containing neodymium are used in green technologies such as the manufacture of wind turbines and hybrid cars. |
| Lanthanum | Used in catalytic converters in cars, enabling them to run at high temperatures |
| Cerium | This element is used in camera and telescope lenses. |
| Praseodymium | Used to create strong metals for use in aircraft engines. |
| Gadolinium | Used in X-ray and MRI scanning systems, and also in television screens. |
| Yttrium, terbium, europium | Making televisions and computer screens and other devices that have visual displays. |
If the world is going to move towards a more sustainable and efficient future, metals—both tough and smart—are going to be critical. Each one will serve a particular purpose to build the infrastructure and technology for the next generation.
Our ability to deploy technology with the right materials will test the world’s mettle to meet the challenges of tomorrow—so choose wisely.


Mining
The Biggest Salt Producing Countries in 2023
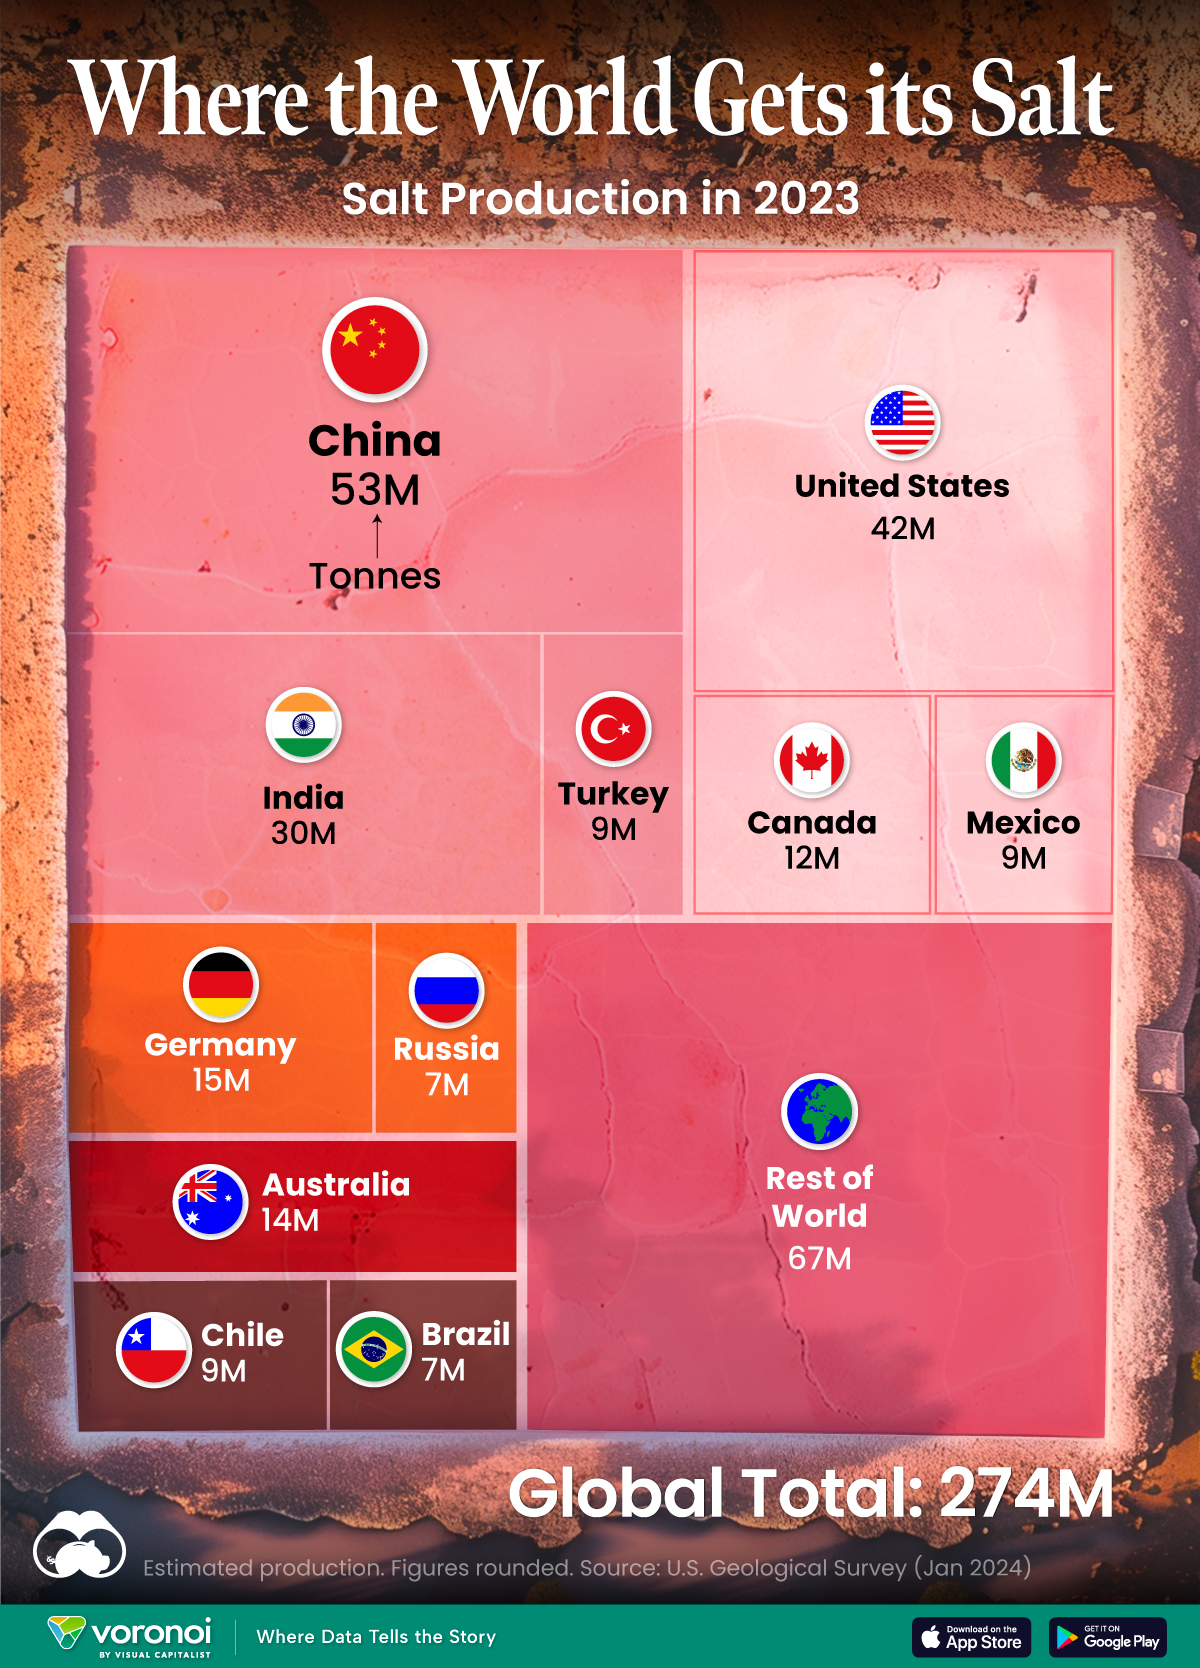
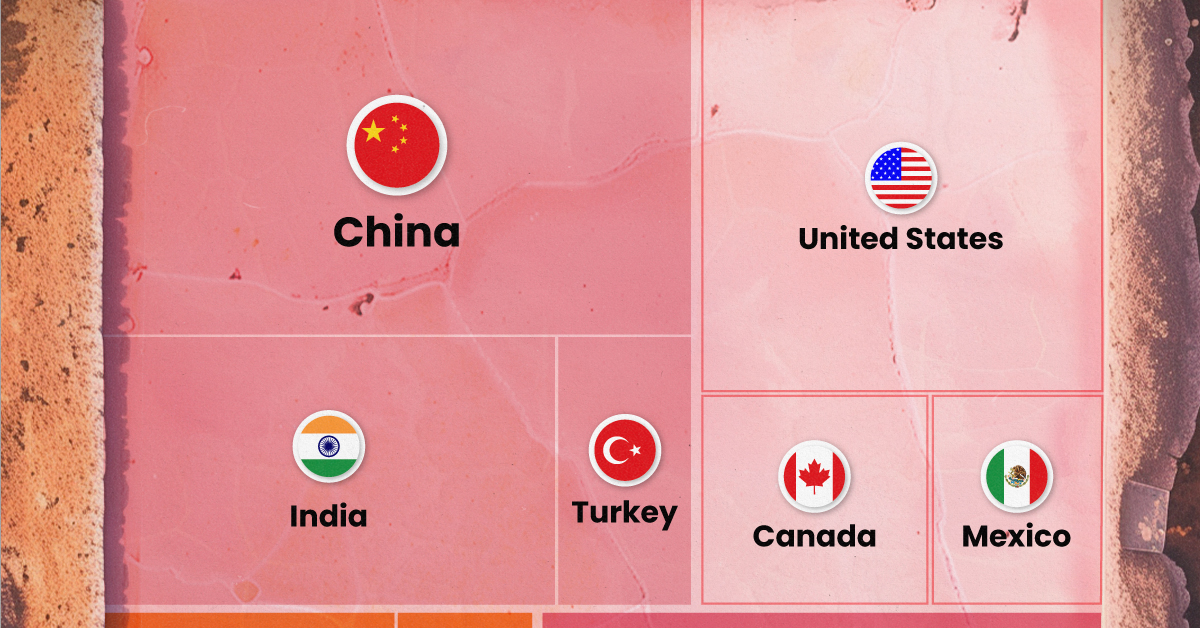
In this graphic, we break down global salt production in 2023. China is currently the top producer, accounting for almost 20% of output.
The Biggest Salt Producing Countries in 2023
This was originally posted on our Voronoi app. Download the app for free on iOS or Android and discover incredible data-driven charts from a variety of trusted sources.
Humanity has utilized salt for thousands of years, dating back to ancient civilizations. The U.S. alone consumes more than 48 million tonnes of salt per year.
In this graphic, we break down global salt production in 2023, measured in tonnes. These estimates come from the U.S. Geological Survey’s latest commodity report on salt.
Ample Supply
Salt is essential for human life, serving various purposes including food preservation, flavor enhancement, industrial processes, and health maintenance. The good news is that the world’s continental resources of salt are vast, and the salt content in the oceans is nearly unlimited.
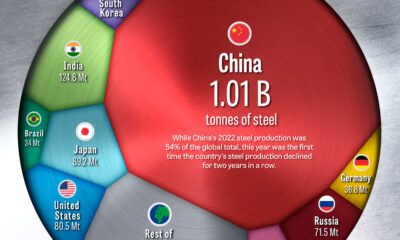
China is currently the top producer of salt, with almost 20% of the output, followed by the U.S. (15%) and India (11%).
| Country | Production (tonnes) |
|---|---|
| 🇨🇳 China | 53,000,000 |
| 🇺🇸 United States | 42,000,000 |
| 🇮🇳 India | 30,000,000 |
| 🇩🇪 Germany | 15,000,000 |
| 🇦🇺 Australia | 14,000,000 |
| 🇨🇦 Canada | 12,000,000 |
| 🇨🇱 Chile | 9,200,000 |
| 🇲🇽 Mexico | 9,000,000 |
| 🇹🇷 Turkey | 9,000,000 |
| 🇷🇺 Russia | 7,000,000 |
| 🇧🇷 Brazil | 6,600,000 |
| Rest of world | 67,000,000 |
| Global total | 273,800,000 |
The global salt market was valued at $32.6 billion in 2022.
It’s projected to grow from $34.1 billion in 2023 to $48.6 billion by 2030, with a CAGR of 5.2% during the forecast period. This suggests a surprising amount of growth for what is one of the world’s oldest and most common commodities.
Facts About the U.S. Salt Industry
In the U.S., salt is produced by 25 companies, which operate 63 plants across 16 states.
The states that produce the most salt are Kansas, Louisiana, Michigan, New York, Ohio, Texas, and Utah. Altogether, these states account for 95% of domestic production.
The primary uses of salt in the U.S. are highway de-icing (41%), chemical production (38%), and food processing (10%).

-

 Personal Finance1 week ago
Visualizing the Tax Burden of Every U.S. State
-

 Misc6 days ago
Visualized: Aircraft Carriers by Country
-

 Culture6 days ago
How Popular Snack Brand Logos Have Changed
-

 Mining1 week ago
Visualizing Copper Production by Country in 2023
-

 Misc1 week ago
Charted: How Americans Feel About Federal Government Agencies
-

 Healthcare1 week ago
Which Countries Have the Highest Infant Mortality Rates?
-

 Demographics1 week ago
Mapped: U.S. Immigrants by Region
-

 Maps1 week ago
Mapped: Southeast Asia’s GDP Per Capita, by Country