Mapped: Europe’s GDP Per Capita, by Country
The Growth of a $1,000 Equity Investment, by Stock Market
Mapped: The Most Valuable Company in Each Southeast Asian Country
Visualizing Global Inflation Forecasts (2024-2026)
The World’s Fastest Growing Emerging Markets (2024-2029 Forecast)
Countries With the Highest Rates of Crypto Ownership
Mapped: The Number of AI Startups By Country
All of the Grants Given by the U.S. CHIPS Act
Visualizing AI Patents by Country
How Tech Logos Have Evolved Over Time
Visualizing the Tax Burden of Every U.S. State
Charted: What Frustrates Americans About the Tax System
Ranked: The Top 20 Countries in Debt to China
Charted: Which Country Has the Most Billionaires in 2024?
Charted: Which City Has the Most Billionaires in 2024?
Which Countries Have the Highest Infant Mortality Rates?
Life Expectancy by Region (1950-2050F)
What Causes Preventable Child Deaths?
The Cost of an EpiPen in Major Markets
Charted: Global Tobacco Use by Country and Sex
Who’s Building the Most Solar Energy?
Mapped: The Age of Energy Projects in Interconnection Queues, by State
Ranked: The Top 10 EV Battery Manufacturers in 2023
The World’s Biggest Nuclear Energy Producers
The World’s Biggest Oil Producers in 2023
Mapped: U.S. Immigrants by Region
Mapped: Southeast Asia’s GDP Per Capita, by Country
The Largest Earthquakes in the New York Area (1970-2024)
Mapped: Average Wages Across Europe
Mapped: Asia’s Population Patterns by Density
Where the World’s Aluminum is Smelted, by Country
Visualizing Global Gold Production in 2023
Gold vs. S&P 500: Which Has Grown More Over Five Years?
Charted: The Value Gap Between the Gold Price and Gold Miners
How People Get Around in America, Europe, and Asia
The Carbon Footprint of Major Travel Methods
Ranking the Top 15 Countries by Carbon Tax Revenue
Ranked: The Countries With the Most Air Pollution in 2023
Top Countries By Forest Growth Since 2001
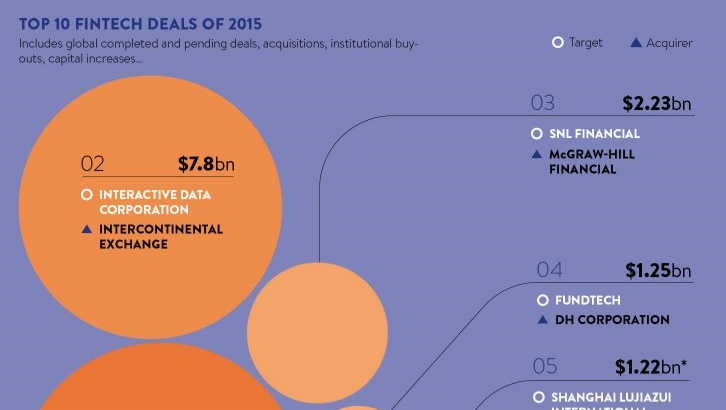
The fintech sector has been on fire lately. In today's infographic, we look back on the sector in 2015 to review the 10 biggest fintech deals...
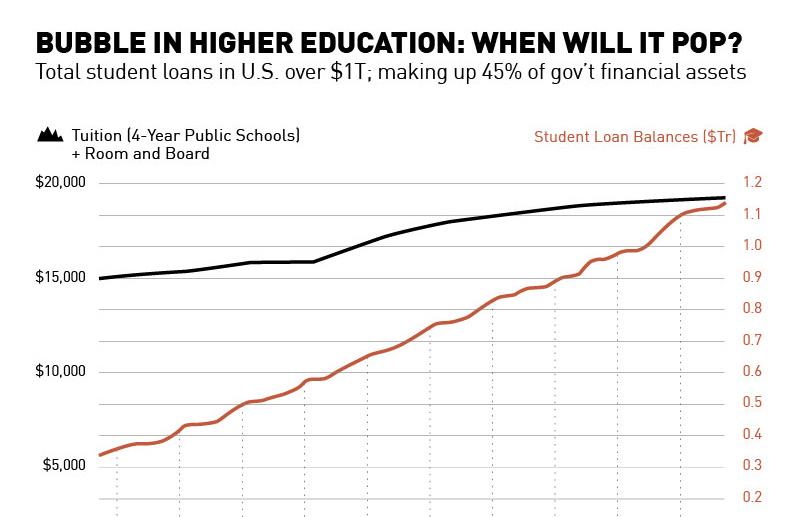
The bubble in higher education is starting to come to a head: student loan delinquencies are rising, the government is dominating the loan market, and colleges...
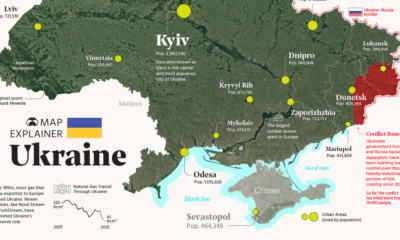
Ukraine has made the headlines due to the ongoing tensions with Russia. In this map infographic, we examine Ukraine from a structural point of view.
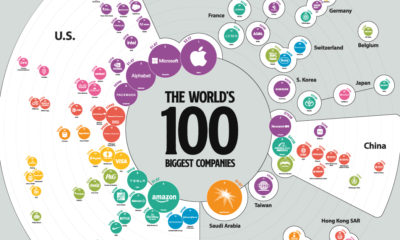
The 100 biggest companies in the world were worth a record-breaking $31.7 trillion as of the end of Q1, up 48% year-over-year.
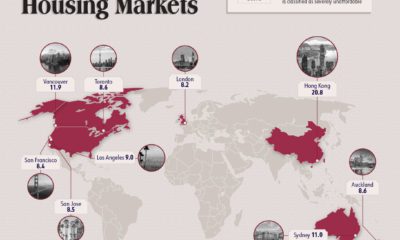
For the 10th consecutive year, Hong Kong ranks as the least affordable city. Vancouver Canada is the second, followed by Sydney, Australia.
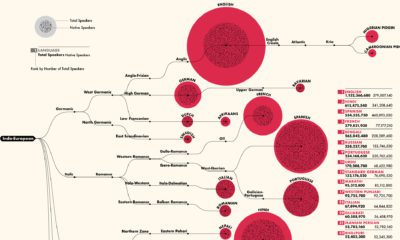
This detailed visualization breaks down the 100 most spoken languages around the world, by total and native speakers. Can you find yours on the list?
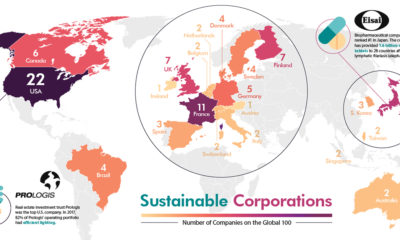
The world's most sustainable corporations have a monumental impact on social and environmental issues. See where they are located in this visualization.
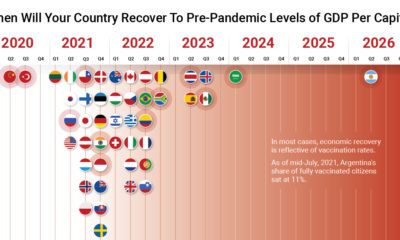
The path to COVID-19 recovery varies worldwide—some countries have already recovered, while others will not be back to normal for years.
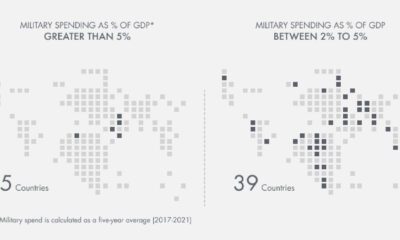
Which countries have the highest military spend relative to their economy? This visual breaks down the amount spent in each country by GDP.
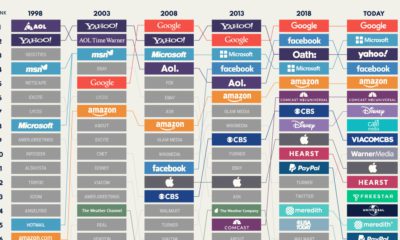
A lot has changed since Yahoo and AOL were the homepages of choice. This visualization looks at the largest internet giants in the U.S. since 1998.


 Creator Program