Ranked: The Top 6 Economies by Share of Global GDP (1980-2024)
Mapped: Europe’s GDP Per Capita, by Country
The Growth of a $1,000 Equity Investment, by Stock Market
Mapped: The Most Valuable Company in Each Southeast Asian Country
Visualizing Global Inflation Forecasts (2024-2026)
Countries With the Highest Rates of Crypto Ownership
Mapped: The Number of AI Startups By Country
All of the Grants Given by the U.S. CHIPS Act
Visualizing AI Patents by Country
How Tech Logos Have Evolved Over Time
Visualizing the Tax Burden of Every U.S. State
Charted: What Frustrates Americans About the Tax System
Ranked: The Top 20 Countries in Debt to China
Charted: Which Country Has the Most Billionaires in 2024?
Charted: Which City Has the Most Billionaires in 2024?
Mapped: Countries Where Recreational Cannabis is Legal
Which Countries Have the Highest Infant Mortality Rates?
Life Expectancy by Region (1950-2050F)
What Causes Preventable Child Deaths?
The Cost of an EpiPen in Major Markets
Who’s Building the Most Solar Energy?
Mapped: The Age of Energy Projects in Interconnection Queues, by State
Ranked: The Top 10 EV Battery Manufacturers in 2023
The World’s Biggest Nuclear Energy Producers
The World’s Biggest Oil Producers in 2023
Mapped: U.S. States By Number of Cities Over 250,000 Residents
Mapped: U.S. Immigrants by Region
Mapped: Southeast Asia’s GDP Per Capita, by Country
The Largest Earthquakes in the New York Area (1970-2024)
The Biggest Salt Producing Countries in 2023
Visualizing Copper Production by Country in 2023
Where the World’s Aluminum is Smelted, by Country
Visualizing Global Gold Production in 2023
How People Get Around in America, Europe, and Asia
The Carbon Footprint of Major Travel Methods
Ranking the Top 15 Countries by Carbon Tax Revenue
Ranked: The Countries With the Most Air Pollution in 2023
Top Countries By Forest Growth Since 2001
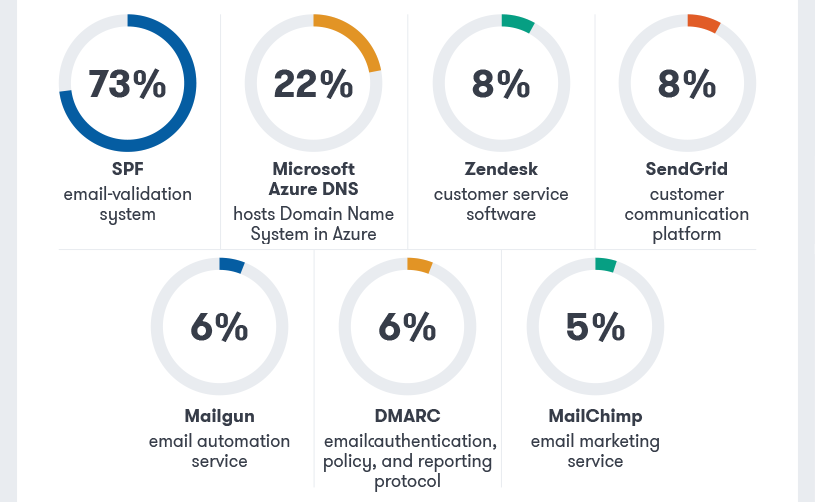
Ever wonder what technologies are used by the upstart companies that dominate the Inc. 5000 list? See what powers their growth in this infographic.
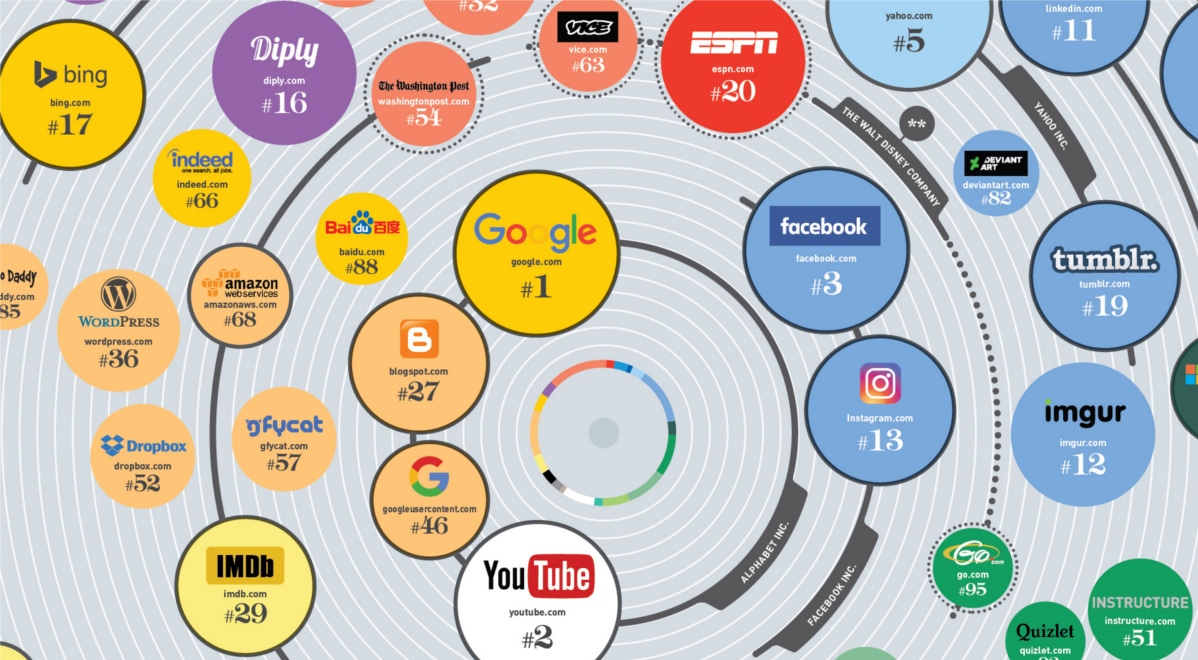
These are the 100 biggest websites in the United States, broken down by type as well as the parent company that owns them.
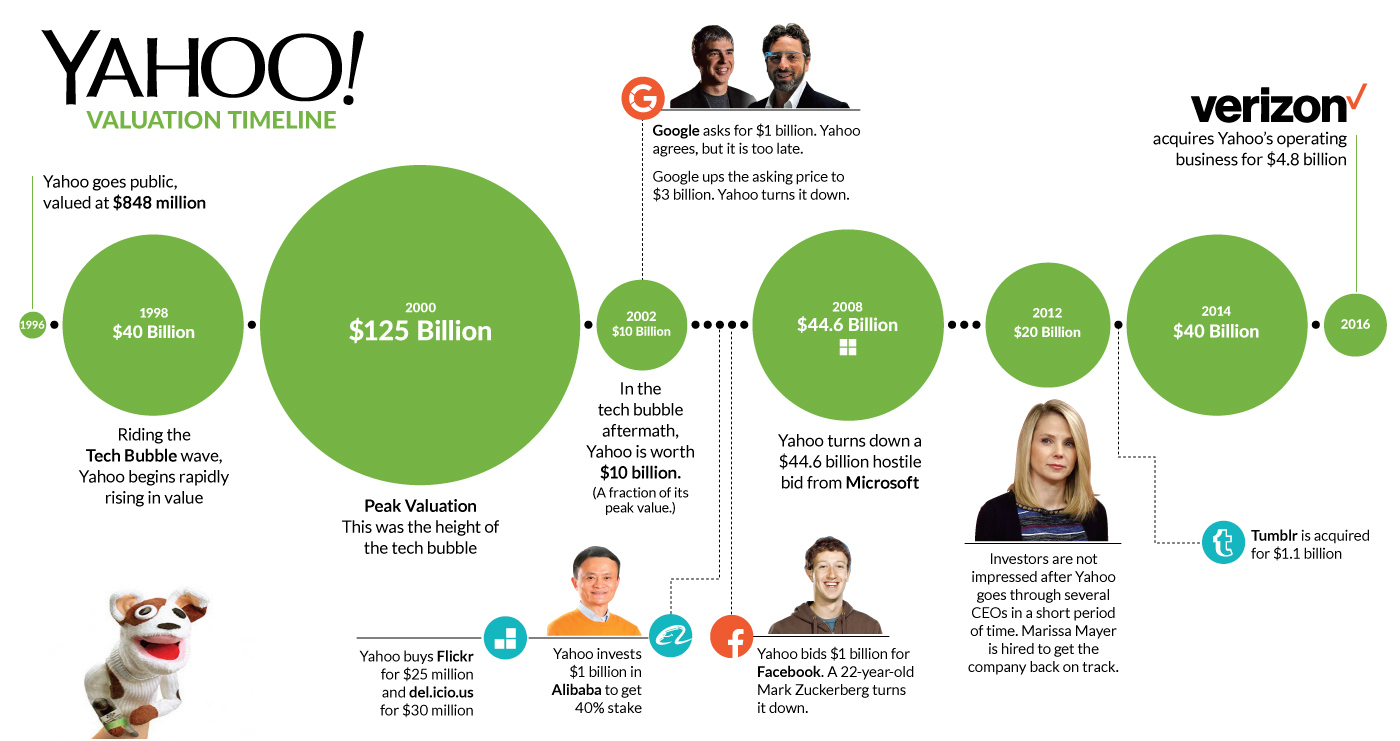
The roller coaster for Yahoo finally ends. This timeline shows where Yahoo execs went wrong during the company's 20 year history.
Why is payments startup Stripe worth $9B? Partly, because it's made it so easy to tap into the backend, allowing the creation of a massive Stripe...
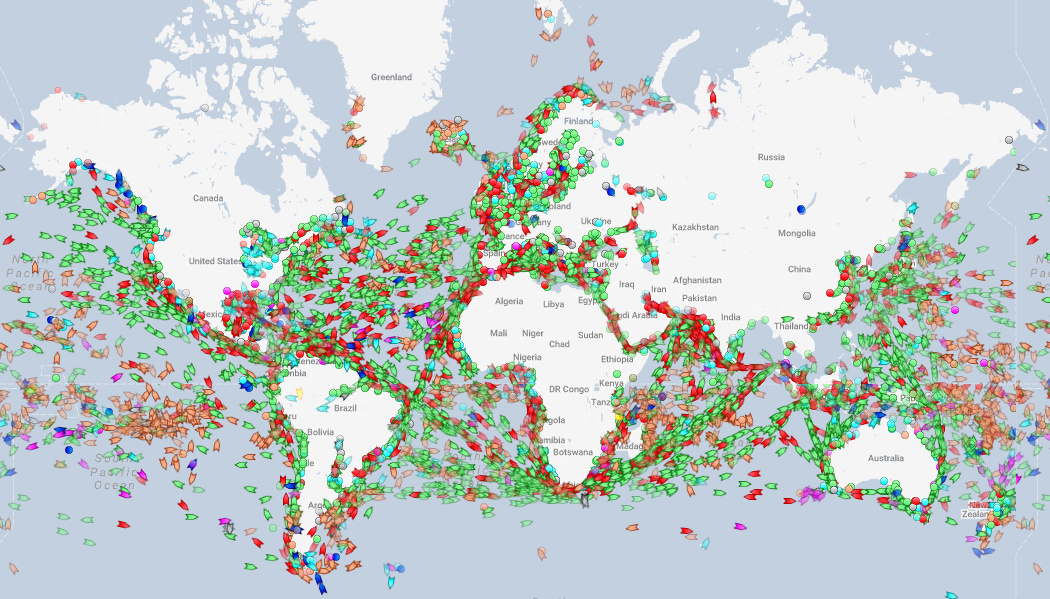
We show you a website that tracks every ship in real-time, and use it to highlight the world's oil chokepoints, the coast of Somalia, and other...
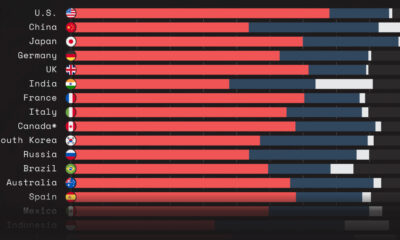
This graphic shows GDP by country, broken down into three main sectors: services, industry, and agriculture.
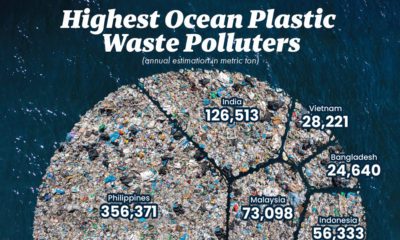
This graphic visualizes the top 10 countries emitting plastic pollutants into our oceans.
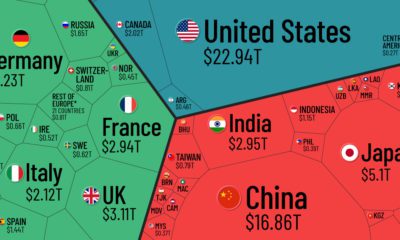
Which countries and regions contribute the most to the world economy? In this infographic, we break down all $94 trillion of global GDP by country.
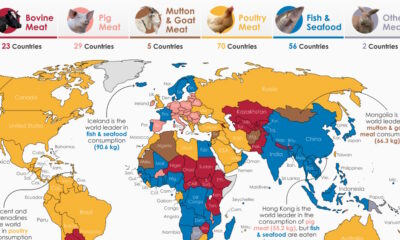
By examining meat consumption by country, we uncover regional differences in how much, and what type of meat people around the world prefer.
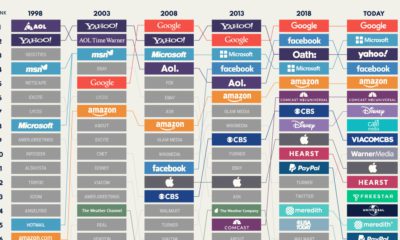
A lot has changed since Yahoo and AOL were the homepages of choice. This visualization looks at the largest internet giants in the U.S. since 1998.


 Creator Program