Ranked: The Top 6 Economies by Share of Global GDP (1980-2024)
Mapped: Europe’s GDP Per Capita, by Country
The Growth of a $1,000 Equity Investment, by Stock Market
Mapped: The Most Valuable Company in Each Southeast Asian Country
Visualizing Global Inflation Forecasts (2024-2026)
Countries With the Highest Rates of Crypto Ownership
Mapped: The Number of AI Startups By Country
All of the Grants Given by the U.S. CHIPS Act
Visualizing AI Patents by Country
How Tech Logos Have Evolved Over Time
Visualizing America’s Average Retirement Savings, by Age
Visualizing the Tax Burden of Every U.S. State
Charted: What Frustrates Americans About the Tax System
Ranked: The Top 20 Countries in Debt to China
Charted: Which Country Has the Most Billionaires in 2024?
Mapped: Countries Where Recreational Cannabis is Legal
Which Countries Have the Highest Infant Mortality Rates?
Life Expectancy by Region (1950-2050F)
What Causes Preventable Child Deaths?
The Cost of an EpiPen in Major Markets
Who’s Building the Most Solar Energy?
Mapped: The Age of Energy Projects in Interconnection Queues, by State
Ranked: The Top 10 EV Battery Manufacturers in 2023
The World’s Biggest Nuclear Energy Producers
The World’s Biggest Oil Producers in 2023
Mapped: U.S. States By Number of Cities Over 250,000 Residents
Mapped: U.S. Immigrants by Region
Mapped: Southeast Asia’s GDP Per Capita, by Country
The Largest Earthquakes in the New York Area (1970-2024)
The Biggest Salt Producing Countries in 2023
Visualizing Copper Production by Country in 2023
Where the World’s Aluminum is Smelted, by Country
Visualizing Global Gold Production in 2023
How People Get Around in America, Europe, and Asia
The Carbon Footprint of Major Travel Methods
Ranking the Top 15 Countries by Carbon Tax Revenue
Ranked: The Countries With the Most Air Pollution in 2023
Top Countries By Forest Growth Since 2001
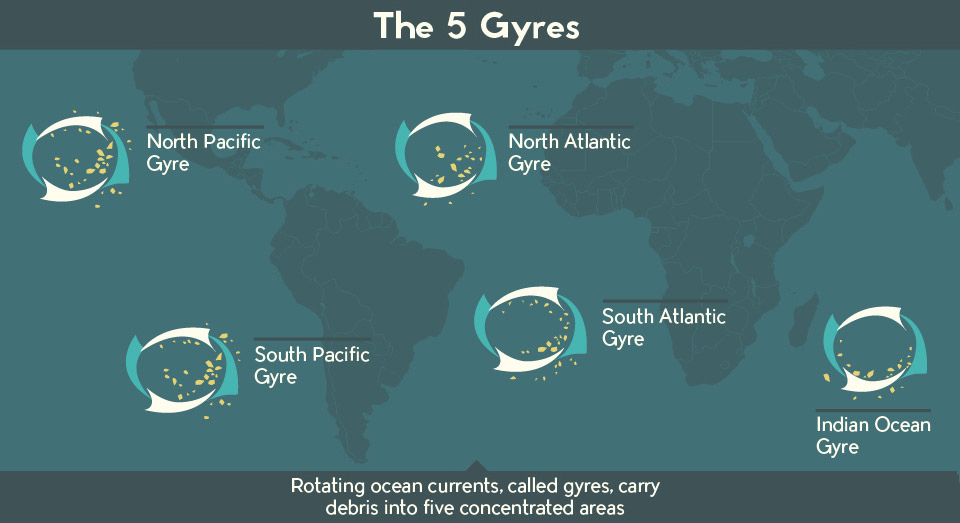
There is a staggering amount of plastic debris swirling around our oceans. This infographic and video help put this plastic problem in perspective.
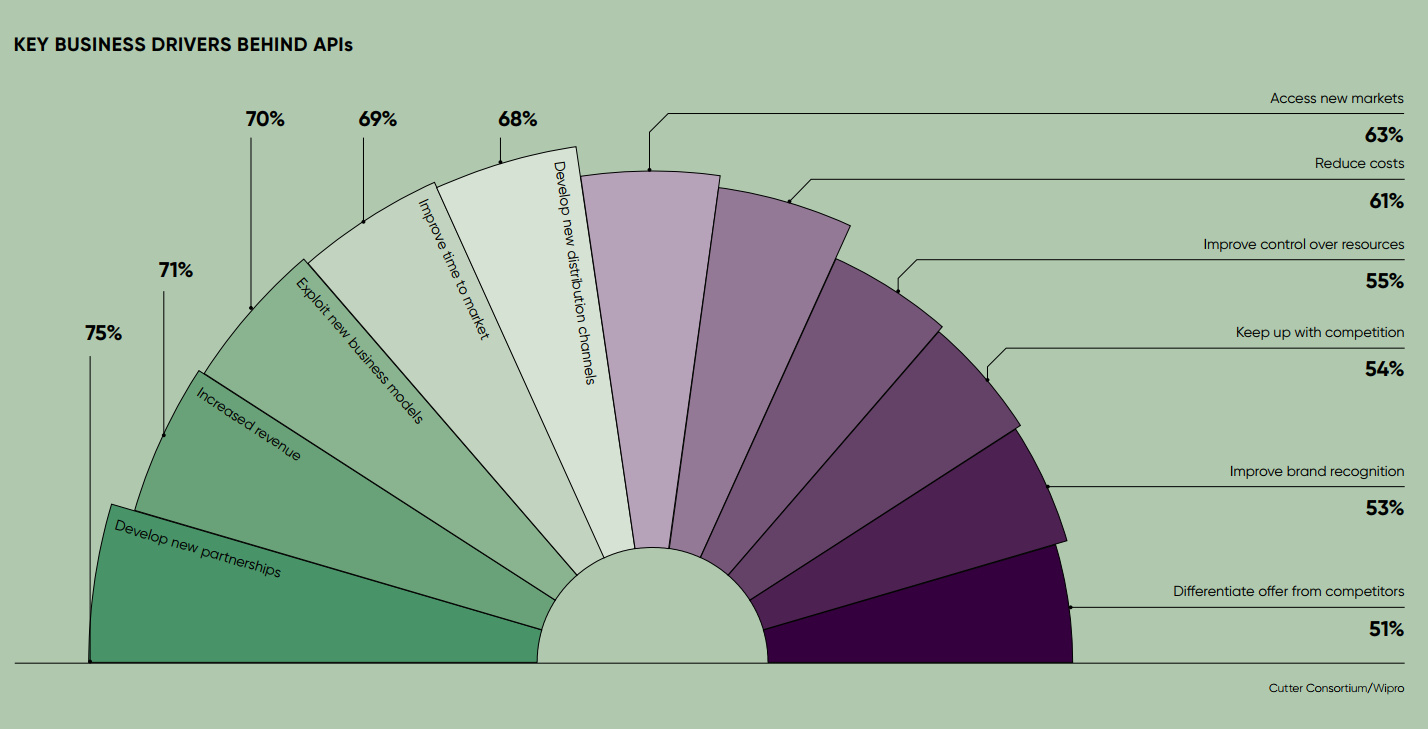
From searching flight deals to checking the weather, we rely on connected digital platforms in many ways. APIs work behind the scenes to make it all...
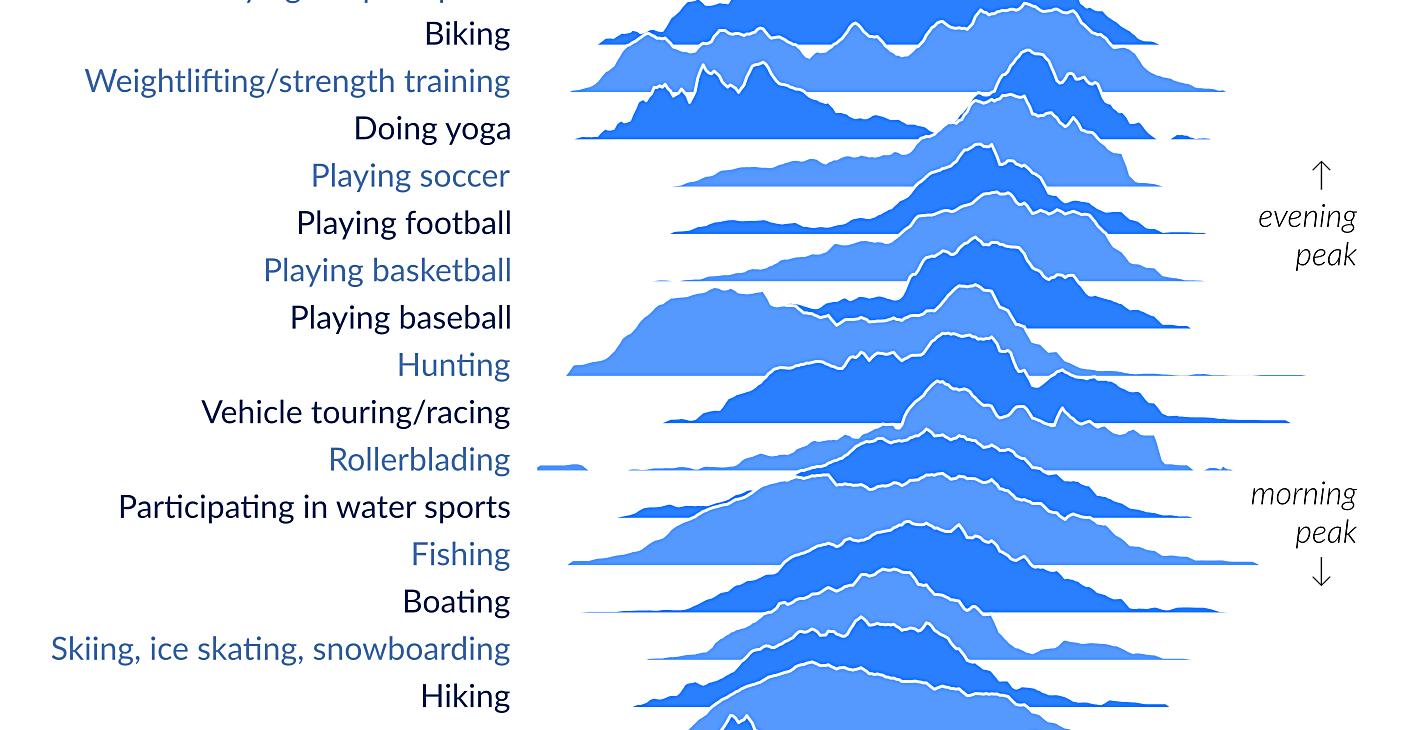
When are people doing activities like playing baseball or working out? This visualization shows how Americans spend free time, and when each activity peaks.
Here’s a look at the different parts of Amazon’s revenue model, and how much money each business segment makes.
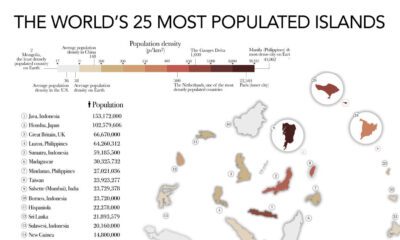
The most populated islands of the earth are teeming hubs of human activity, a far cry from the remote paradises in popular imaginations.
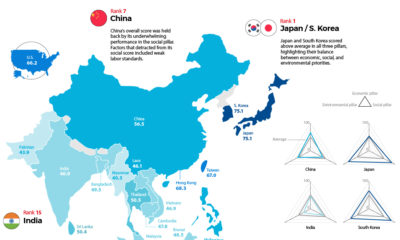
The Sustainable Trade Index ranks 19 Asian economies and the U.S. across three categories of trade sustainability.
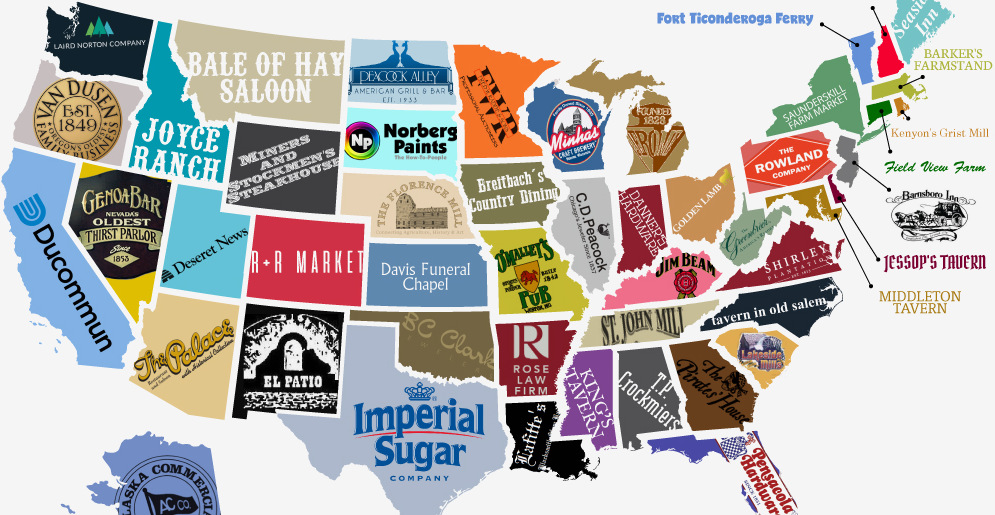
Is the oldest business in your state a well-known brand, or a mom-and-pop shop? This infographic shows the oldest company in each state in the U.S.
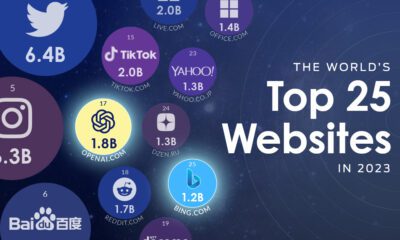
OpenAI is now one of the world's top websites, rapidly approaching the level of traffic received by TikTok and Amazon.
With so much misinformation spreading on the pandemic, we've compiled a quality list of data-driven and unbiased COVID-19 resources for you to use.
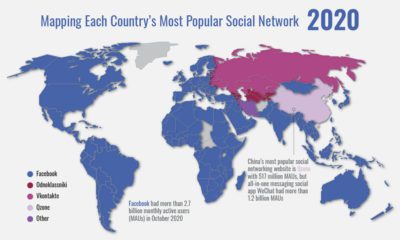
Mapping the rapid expansion of Facebook into the world’s dominant social network, and the countries and platforms resisting its growth


 Creator Program