
From Eli Lilly to Pfizer, this graphic shows the largest pharmaceutical companies around the world by region.


click for more →


Scan with your phone's camera or QR code app to view
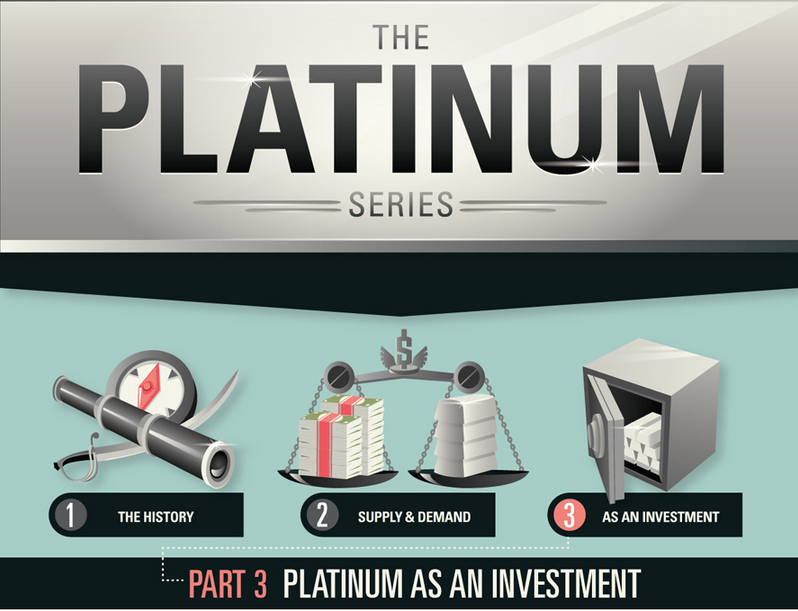
Global demand for platinum as an investment has increased 30x since 2003.
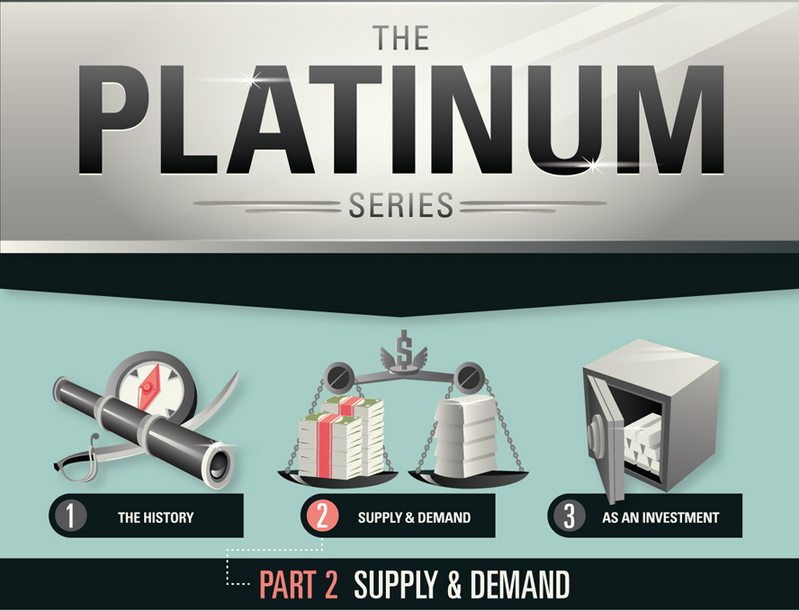
Platinum’s supply is concentrated in medium-to-high risk jurisdictions, while demand is strongly tied to worldwide auto production.

While gold and platinum are almost equally as rare, the amount of platinum mined through history is only a fraction.
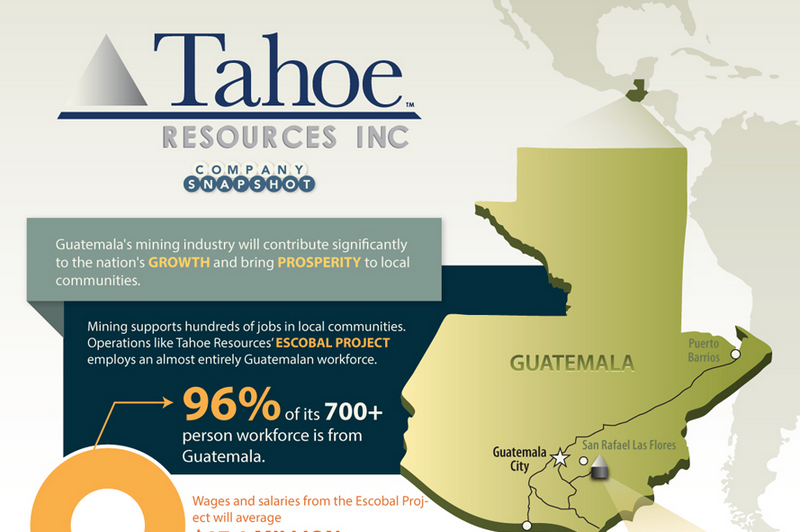
Tahoe Resources Inc. is a publicly traded company (TSX:THO /NYSE:TAHO) led by experienced mining professionals who are dedicated to the responsible production of precious metals in...
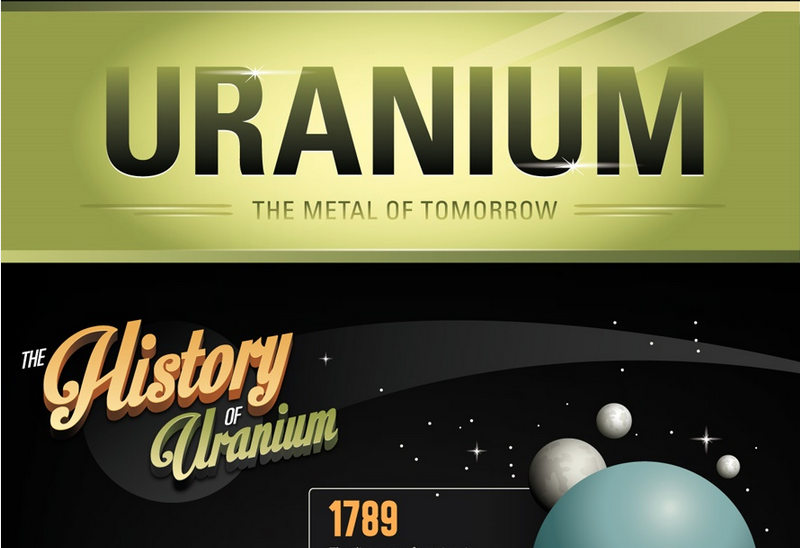
Nuclear power accounts for 5.7% of the world’s energy and 13% of the world’s electricity. Uranium, used in nuclear power, is a relatively clean source of...

The Athabasca Basin currently accounts for 15.5% of annual uranium production. Even more interesting, is the grade of these deposits. 10 of the 15 highest grade...
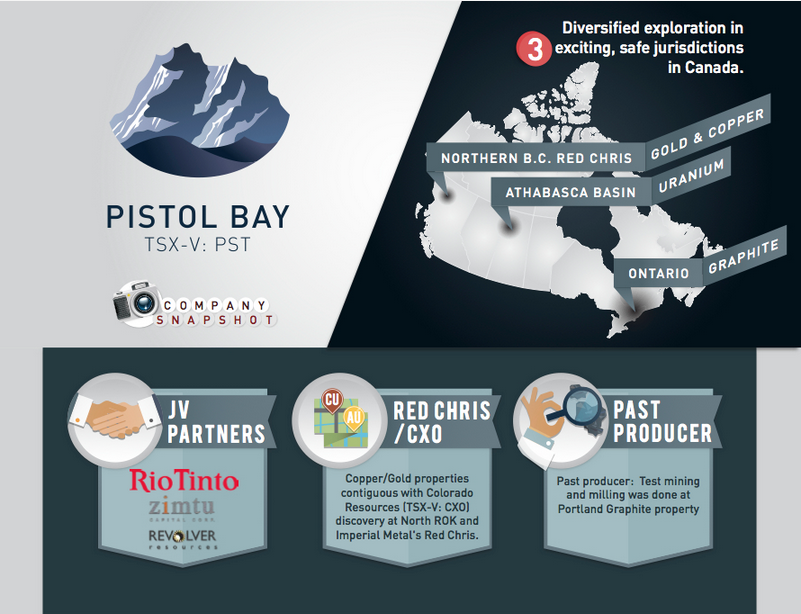
Pistol Bay Mining Inc. (TSX-V:PST) is a diversified junior Canadian mineral exploration company with a focus on precious and base metal properties in North America. Pistol...

How should investors approach sub $1,300 gold? Our analysts each take a side and answer five questions – here we present the Bull and the Bear...
Magnetite ore, long the leading source of domestic iron supply in North America, Europe and China, is now increasingly relevant across the globe. The perception that...
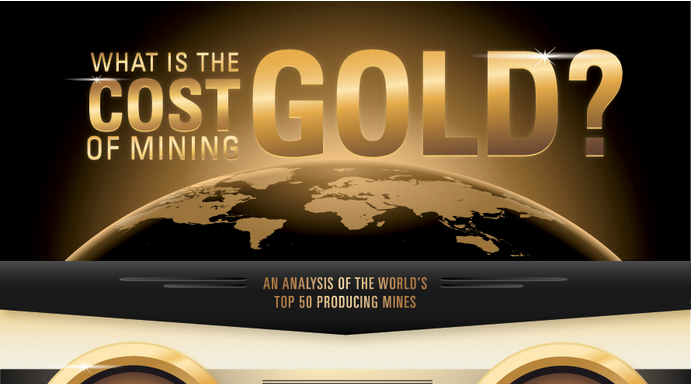
We’ve analyzed the Top 50 Gold Mines to find the cost per ounce of gold by continent. The top 50 gold mines alone contain more than 33.5%...

The volatility of biotech stocks provides an opportunity for investors. From discovery to commercialization, the drug development process takes many years. Different regulatory events and data...
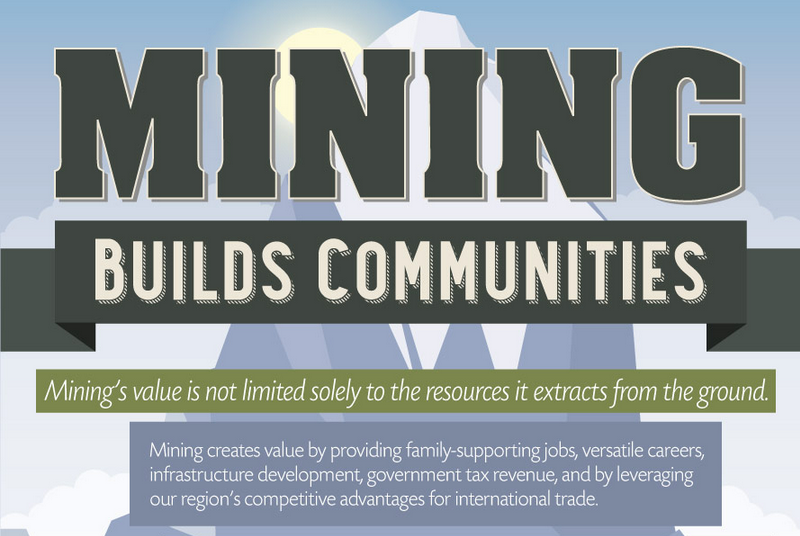
For BC Mining Week, we’ve partnered with MABC and MSABC to show how mining creates and supports jobs in communities. Mining’s impact in communities stretches far...

Measuring market data using fiat currencies can be misleading – even though an asset may rise in dollars, it may be because of declining currency value...


Presented by Dollar Vigilante and Bitcoin ATM. Thanks to Gold.net for financial data. What currency is feared by the European Central Bank as a threat to fiat...


 Creator Program
