Mapped: Europe’s GDP Per Capita, by Country
The Growth of a $1,000 Equity Investment, by Stock Market
Mapped: The Most Valuable Company in Each Southeast Asian Country
Visualizing Global Inflation Forecasts (2024-2026)
The World’s Fastest Growing Emerging Markets (2024-2029 Forecast)
Countries With the Highest Rates of Crypto Ownership
Mapped: The Number of AI Startups By Country
All of the Grants Given by the U.S. CHIPS Act
Visualizing AI Patents by Country
How Tech Logos Have Evolved Over Time
Visualizing the Tax Burden of Every U.S. State
Charted: What Frustrates Americans About the Tax System
Ranked: The Top 20 Countries in Debt to China
Charted: Which Country Has the Most Billionaires in 2024?
Charted: Which City Has the Most Billionaires in 2024?
Life Expectancy by Region (1950-2050F)
What Causes Preventable Child Deaths?
The Cost of an EpiPen in Major Markets
Charted: Global Tobacco Use by Country and Sex
Visualized: What Lives in Your Gut Microbiome?
Who’s Building the Most Solar Energy?
Mapped: The Age of Energy Projects in Interconnection Queues, by State
Ranked: The Top 10 EV Battery Manufacturers in 2023
The World’s Biggest Nuclear Energy Producers
The World’s Biggest Oil Producers in 2023
The Largest Earthquakes in the New York Area (1970-2024)
Mapped: Average Wages Across Europe
Mapped: Asia’s Population Patterns by Density
A Map of Global Happiness By Country in 2024
Mapped: Population Growth by Region (1900-2050F)
Where the World’s Aluminum is Smelted, by Country
Visualizing Global Gold Production in 2023
Gold vs. S&P 500: Which Has Grown More Over Five Years?
Charted: The Value Gap Between the Gold Price and Gold Miners
How People Get Around in America, Europe, and Asia
The Carbon Footprint of Major Travel Methods
Ranking the Top 15 Countries by Carbon Tax Revenue
Ranked: The Countries With the Most Air Pollution in 2023
Top Countries By Forest Growth Since 2001
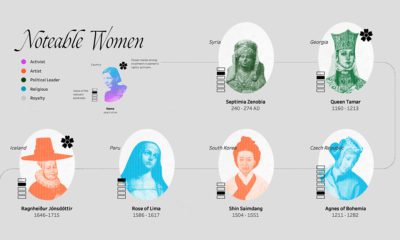
Today, only 15% of banknotes feature women. This infographic looks at who these women are and which countries feature them on their currency
This graphic compares the cost of living and purchasing power of 578 cities worldwide, using New York City as a benchmark for comparison.
In this visual, we've ranked the top U.S. metropolitan areas in terms of their GDP. How does your city rank?
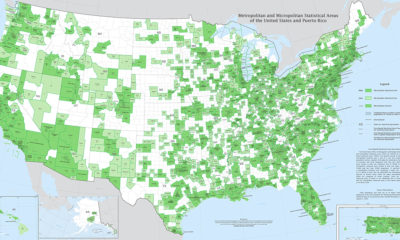
Fitting a complex population center into a tidy statistical box is no easy feat. Thankfully, this U.S. Census Bureau map is up to the challenge.
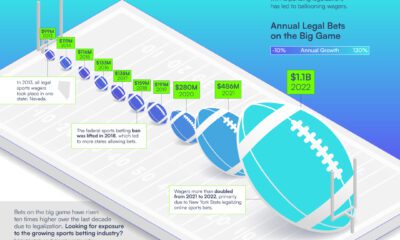
Expanding legalization has driven an increase in bets on football's big game, with wagers more than doubling from 2021 to 2022. (Sponsored Content)
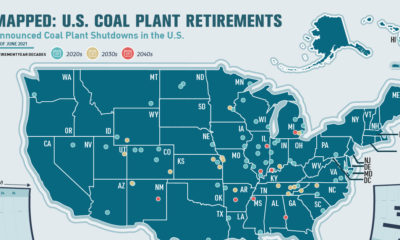
This infographic highlights announced coal plant closures in the U.S. and how much power will be affected.
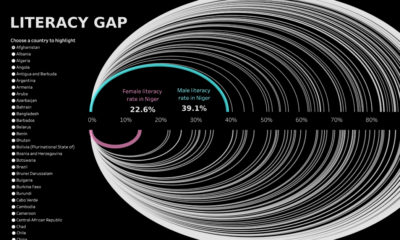
Global literacy rates have increased in the last few decades, but some countries are still lagging behind, especially in Sub-Saharan Africa.
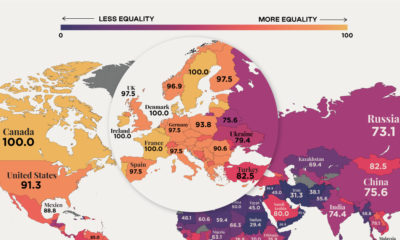
In recent years, many economies have made women’s rights a priority, yet only 10 countries in the world offer full legal protections to women.
This chart looks at some of the common items that are sold on the Dark Web, and how much they sold for on average in 2022.
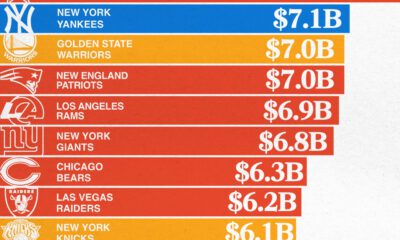
The most valuable sports teams in 2024 range from NBA and MLB teams to renowned soccer clubs in Europe, but the NFL reigned supreme.


 Creator Program